
09/30/2018: Markets were down for the week, as the Leaders were over-bought and in the Red Zones. Now the Indices are slowly correcting back down to the Green Zones, for More Money Wave Buys.
It would be better trading for the Markets to correct more down to the Red Lines (50-day avgs.)
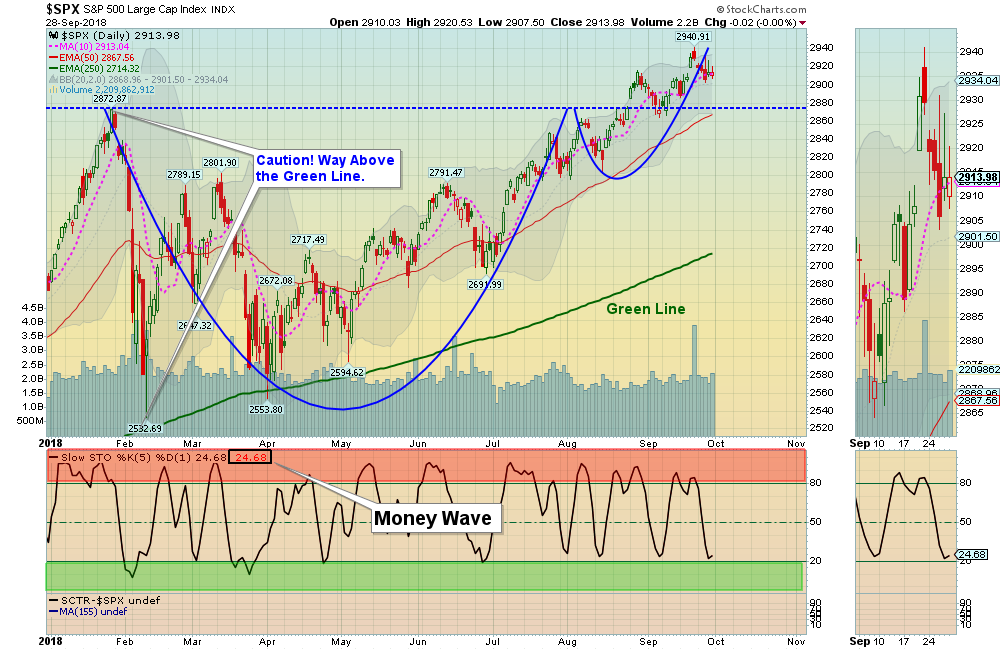
For the week the Dow was down 1.07%, the S&P 500 was down 0.43%, and the Nasdaq 100 was down 1.28%. The S&P 500 now has Support at the January Highs of 2872. The Long Term Trend on the Stock Markets is UP.
The Inflation Index (CRB) was up 0.61% and is Above the Green Line, indicating Economic Strength.
Bonds were up 0.15% for the week and is Below the Green Line, indicating Economic Strength.
The US DOLLAR was up 1.08% for the week, and is back above the Red Line on the FED raise.
Crude Oil was up 3.49% for the week at $73.25, and GOLD was down at $1192.
___________________________________________________________________________________________
MONEY WAVE BUYS SOON:
We are currently in 4 logged Open Positions, for the Short & Medium Term. There are 6 Investments on the Short Term Watch List.
Be patient and WAIT for Green Zone Buys!
______________________________________________________________________________________________
LONG TERM TRADES
Some of last quarter’s favorites are down near or Below their Green Lines, as the Market Internals have narrowed. These tend to do well if they can Bounce up from the Green Lines.
ETFC E*TRADE FINANCIAL Wait for weekly Close Above the Red Line of $56.75 (50-day avg.)
HEAR TURTLE BEACH CORP. Wait for weekly Close Above the Red Line of $22.46 (50-day avg.)
HRTX HERON THERA. Wait for Weekly Money Wave Close > 20.
INTC INTEL CORP. Wait for weekly Close Above the Red Line of $47.80 (50-day avg.)
MU MICRON TECH Wait for weekly Close Above the Red Line of $48.21 (50-day avg.)
THC TELNET HEALTHCARE Wait for Weekly Money Wave Close > 20.
TWTR TWITTER, INC. Wait for weekly Close Above the Red Line of $32.25 (50-day avg.)
URBN URBAN OUTFITTERS Wait for Weekly Money Wave Close > 20.
WTW WEIGHT WATCHERS Wait for weekly Close Above the Red Line of $75.55 (50-day avg.)
___________________________________________________________________________________________
Click for Portfolio (Open Positions)
Click for Watch List
Click for Closed Positions
Alert! Market Risk is High (RedZone). The probability of successful Short Term Trades is better, when the S&P 500 is down near the Green Line.
Tell your Friends about the Green Line, and Help Animals.
QUESTION: When you say “you will Not Log the trade” what does that mean?
ANSWER: If the Reward / Risk is not 2:1 or better we will not log the trade (or count it in our Performance Record). Some members want to see every mechanical Money Wave Buy Signal, but the Money Wave pops are usually only good for 3-6 % in the Short Term. If a stock is already up >3%, we will normally Not Log the trade.
If you Buy an Investment at $12, for a re-test of High at $14, the Reward potential could be $2, or 16.7%. If you have a Stop at $11.5, you are risking $0.50.
So Reward / Risk is $2.00 / $0.50 = 4:1 odds… EXCELLENT!
The Swing Low is the previous Support where Buyers came in, and the Investment bounced.
Good trading, and tell your friends!


