
09/27/2020 Markets were mostly down the week but the Big Techs rallied up from the Lows. The decline from the Highs is fairly slow and the Markets are quickly becoming over-sold. Most of the Indices need to Close back above their Red Lines (50-day avgs.) for more Buying to come in. The CNN Fear & Greed Index is back down to 49.
Interest Rates are being held steady, so the Selling Volume has been mild. The Strongest Investments should pop back up to re-test the recent Highs if the Markets can bounce up from here soon. These are the Semiconductor Fund (SMH), Home Building Fund (XHB), Internet Fund (FDN) Solar Fund (TAN) & Retail Fund (XRT). (Also CRM NVDA SQ & ZS).
PENNY STOCK WATCH LIST has many Green Zones Buy Signals soon that are 50-80% off the recent Highs.
For the week the Dow was down 1.74%, the S&P 500 was down 0.58%, and the Nasdaq 100 was up 1.91%. The Long Term Trend for the Indices is up.
The Inflation Index (CRB) was down 2.14% and is below the Green Line, indicating Economic Weakness.
Bonds were up 0.95% for the week and are Above the Green Line, indicating Economic Weakness.
The US DOLLAR was up 1.75% for the week and is Below the Green Line.
Crude Oil was down 2.59% for the week at $40.25 and GOLD was down 4.88% at $1866.30.
_____________________________________________________________________________________________
MONEY WAVE BUYS SOON
We are currently in 12 logged Current Positions, for the Short & Medium Term. There are 6 Investments on the Short Term Watch List.
Be patient and WAIT for Green Zone Buy Signals!
______________________________________________________________________________________________
LONG TERM INVESTMENTS (Most of the Leaders are back up in the Weekly Red Zones.)
Buy the Leading Investments that are down near the Weekly Green Zones.
COUP COUPA SOFTWARE Bought above $254.95 on Monday. Target is $320.00. Don’t Take a Loss. Up 9.97 % this week.
FB FACEBOOK INC. Buy if it Closes above $259.20 on High Volume.
FCEL FUELCELL ENERGY INC. Buy if it Closes above $3.42 on High Volume. All time High is $682.00.
LLY ELI LILLY & CO. Buy if it Closes above $154.50 on High Volume.
RIOT RIOT BLOCKCHAIN INC. Wait for the next Daily Money Wave Buy. All time High is $46.20.
ZNGA ZYNGA INC. Volume was not High when it Closed above $8.59. Will not log.
______________________________________________________________________________________
Click for Current Positions
Click for Watch List
Click for Closed Positions
Dividend Growth Portfolio (we are now posting a Dividend Calendar for the entire portfolio to assist with planning purposes).
ETF Sector Rotation System – The System will liquidate all 5 positions on Sep 30 will probably Buy SPY QQQ SLV EEM & EFA on Oct 1, 2020 (20% into each).
Long Term Strategy for IRAs & 401k Plans
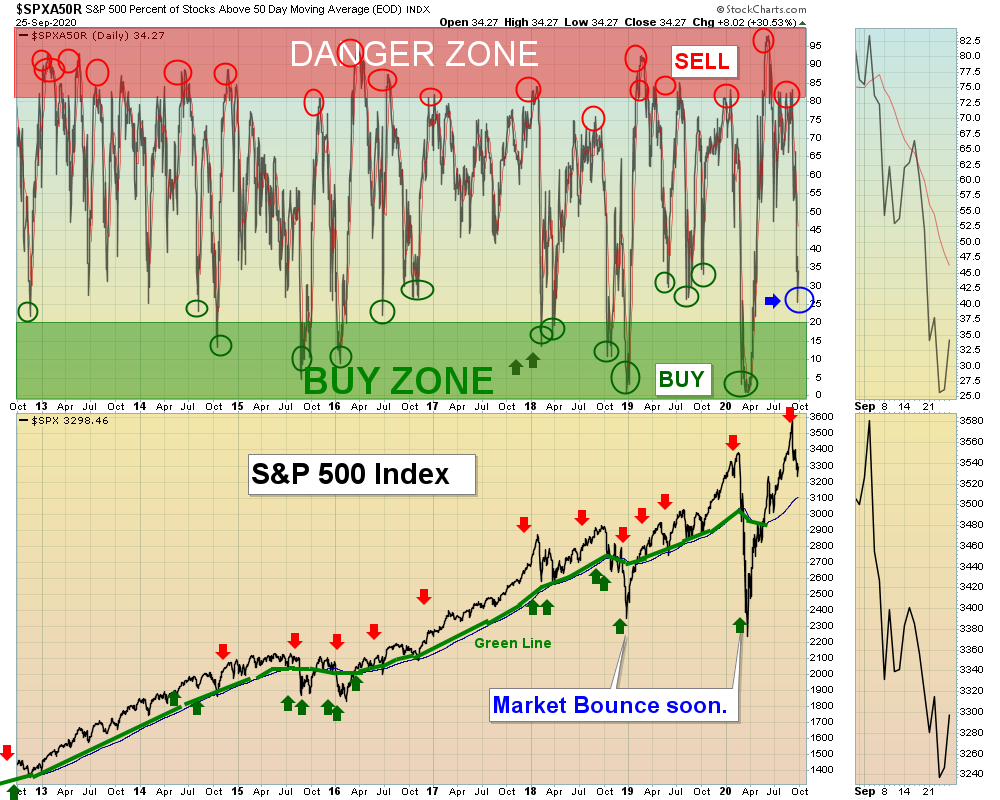
Alert! Market Risk is MEDIUM (Yellow Zone). The probability of successful Short Term Trades is better, when the % of stocks above the 50-day avg. is below 20.
Tell your Friends about the Green Line, and Help Animals
___________________________________________________________________________________________
QUESTION: CDS writes “Are you moving from Trailing % Stops $ Stops on most of these holdings? I ask because that most of the Buys from the last few days have already been stopped out as their 5% (or 3%) trailing stops have been triggered (NVDA,ZS,DOCU,BIG,AMD,SPWR). Clarification please?
ANSWER: Sorry for the confusion.
We have been missing many Money Wave Buys that ended up being 5-10% higher on the Close. So lately we have been placing specific Buy Prices on trades, with a 5% Trailing Sell Stop Loss below it . The Trailing Stop is to keep us from getting whipsawed if there was a quick Reversal after the Investment popped up above the Buy Price. Or to captured a nice 20% + pop up, that could fade before the Close.
We will revise the Buy Order: Buy above $10 with a 5% Trading Sell Stop Loss until it Closes. Then we will revert back to the normal Green Line Rules (EXIT below recent Support, for Short Term Trades)
Please monitor the WATCH LIST and CURRENT POSITIONS pages before making a trade, as they are constantly updated during the day.


