
09/02/2018: Markets were up for the week, as several major Indices made New Highs. The DOW Index, NYSE Index, and World Index have not made New Highs yet and are all weaker than they were in January.
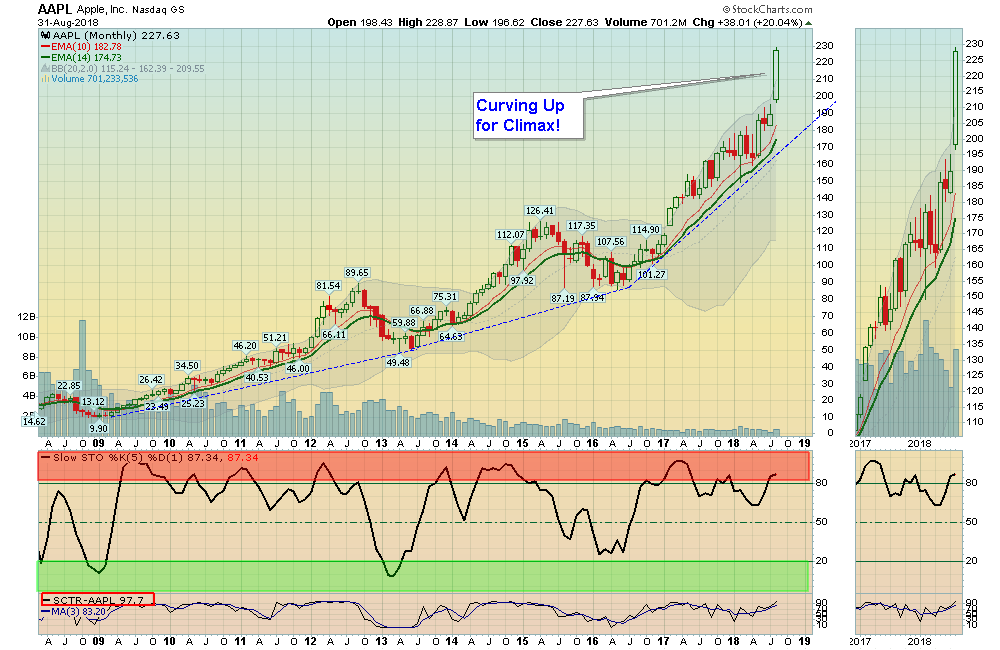
A few of the Darling favorites “Melted Up” in August. While the S&P 500 was up 3.03%, AAPL was up 20%. AMZN was up 13% and SQ was up 37% (without any significant news). This is similar to the Internet Bubble “Melt Up” of 1999.
Consumer Confidence is the highest is 18 years, so Investors FEEL as good as they did in the Internet Bubble of 1999.
Normally the over-bought Markets will fade back down to test the January Highs of 2872 to see if that level becomes new Support.
For the week the Dow was up 0.68%, the S&P 500 was up 0.97%, and the Nasdaq 100 was up 2.29%. The Long Term Trend on the Stock Markets is UP.
The Inflation Index (CRB) was up 0.46% and is Below the Green Line, indicating Economic weakness.
Bonds were down 1.06% for the week and Closed Above the Green Line, indicating Economic weakness.
The US DOLLAR was unchanged for the week, and should bounce near the Red Line soon.
Crude Oil was up 1.57% for the week at $69.80, and GOLD was down 0.54% at $1207.
___________________________________________________________________________________________
MONEY WAVE BUYS SOON:
We are currently in 2 logged Open Positions, for the Short & Medium Term. There are 4 Investments on the Short Term Watch List.
Be patient and WAIT for Green Zone Buys!
______________________________________________________________________________________________
LONG TERM TRADES
The Funds below are correcting down to their Green Lines, but the Relative Strength is remaining high. These tend to Bounce nicely when the weekly Money Wave crosses up > 20.
IBKR INTERACTIVE BROKERS Relative Strength is Below 80.
INTC INTEL CORP. Wait for weekly Close Above the Red Line of $49.30 (50-day avg.)
MU MICRON TECH Wait for weekly Close Above the Red Line of $52.58 (50-day avg.)
TWTR TWITTER, INC. Wait for weekly Close Above the Red Line of $36.01 (50-day avg.)
WTW WEIGHT WATCHERS Wait for Weekly Money Wave Close > 20.
___________________________________________________________________________________________
Click for Portfolio (Open Positions)
Click for Watch List
Click for Closed Positions
Alert! Market Risk is High (RedZone). The probability of successful Short Term Trades is better, when the S&P 500 is down near the Green Line.
Tell your Friends about the Green Line, and Help Animals.
QUESTION: Brian writes ” Is there anyway to make your strategy work in the German markets or the forex game. Like things without sctr values?”
ANSWER: Yes Brian, the Green Line System works with ALL Investments and Mutual Funds that can be Charted.
If there is no Symbol, you can manually make a Chart like we did before computers existed. Make sure the Investment stays Above the Green Line (250 day ema).
Determining Relative Strength would be trickier. Most Relative Strength systems use computers to compare the Investment to the S&P 5oo index, or to all Investments that are in the database.


