Above the Green Line -01
  • Market Insights
        • Commentary
          • Daily
          • Weekly
        • BUY / SELL SIGNALS
          • Trade Posts
          • Recent Trade Alerts
          • Recent Day Trades
        • BLOGROLL
          • Dividend Growth Blog
          • ETF Sector Blog
          • Dow Dogs
          • TPOW Blog
  • Strategies
        • SWING TRADING
          • Current Positions
          • Watchlists
          • Closed Positions
          • Candidates - TOP 100
          • Specialty Stocks
        • WEEKLY STOCK PICK
          • TPOW Charts
          • TPOW Performance
          • TPOW Strategy Guide
          • TPOW Performance Dashboard
        • DAY TRADING
          • Watch List
        • ATGL DASHBOARD
        • ETF STRATEGIES
          • ETF Sector Rotation
          • ETF Sector Portfolio
        • DIVIDEND GROWTH
          • Dividend Growth Portfolio
          • Dividend Calendar
        • DOGS OF THE DOW
          • Dogs of the Dow Portfolio
          • DOW 5 Portfolio
  • Markets
        • US MARKET
          • Commodities
          • Energy
          • Precious Metals
          • Volatility
        • GLOBAL MARKETS
          • Market Indices
          • Economic Calendar
          • FOREX Heat Map
          • FOREX Cross Rates
          • Crypto Currency Market
  • Investing
    • Discord Community
    • Dashboard
  • Resources
        • ARTICLES
          • Dividend Growth Model Articles
          • ETF Articles
          • Investment Strategies Articles
          • Market and Economic Insights
          • Stock Trade Articles
          • Stock Reviews
        • TOOLS
          • Stock Scanners
          • Charting Software
          • Brokerage Firms
        • STOCK CHARTS
          • Key Components
          • Reading Charts
          • Drawing Stock Charts
          • Identifying Trends
        • RETIREMENT PLANNING
  • About
    • Contact Us
    • How to Win
    • #1 At Stockcharts
    • Disclaimer
    • FAQ
  • Log In
  • Subscribe

October 31, 2021

Green Line Weekly Oct 31, 2021

SPX Chart
The S&P 500 Index should complete Wave 3 up soon and then correct down near the Red Line (Wave 4).

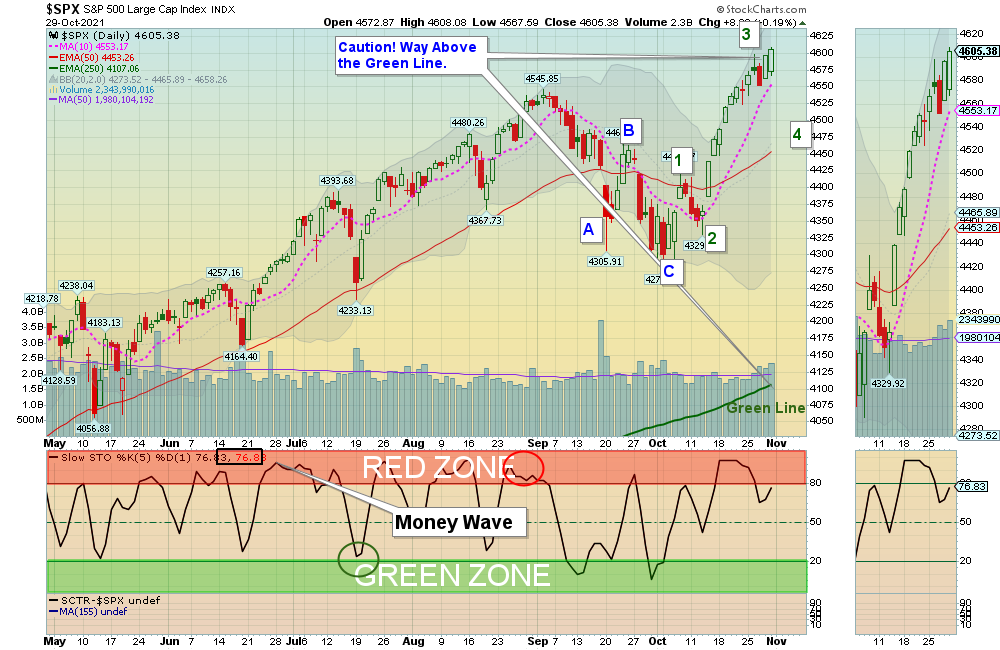
10/31/2021 Markets were higher again this week, as the major Indices were able to exceed the September Highs.The Markets are currently over-bought for the Short Term, and are waiting on 1. Possibly Trillions more of Gov’t. Spending and 2. Expected FED Tapering of their $120 Billion of monthly Debt Buying in November. So Investors will be tested very soon to see how much new money is left to enter the Markets on either Good or Bad News.

The S&P 500 is 1.3% higher than in September but the upward advances are taking longer. The S&P 500 dropped in early October, and then rallied up 7.8% back to New Highs. The Green Line System bought 6 Swing Trades then, which had an average Gain of  11.67%.

The FED is talking about Tapering on their DEBT Buying soon, and FED Printing has been a major reason for the longest Bull Market in history. Investors might have to do less “Buy & Hold” investing and more Market Timing and trading if they want to continue to see their accounts grow.

If you continue to Follow the Green Line System, your Money should flow into the Strongest areas and your account value should be able to  grow in both Bull and Bear Markets.

For the week the Dow was up 0.42%, the S&P 500 was up 1.35%, and the NASDAQ 100 was up 3.21%. The Long Term Trend for the Indices is up. 

The Inflation Index (CRB) was up 0.01% for the week and is Above the Green Line, indicating Economic Expansion.

Bonds were up 2.47% for the week, and are back Above the Green Line, indicating Economic Contraction.

The US DOLLAR was up 0.53% for the week and is Above the Green Line. 

Crude Oil was down 0.23% for the week at $83.57 (a New High) and GOLD was down 0.69%  at $1783.90.

SEE SUPPLEMENTAL CHARTS

_____________________________________________________________________________________________

MONEY WAVE BUYS SOON

We are currently in only 2 logged Current Positions, for the Short & Medium Term (Most Leaders are up in the Red Zones).  There are 8 investments on the Short Term Watch List. 

Be patient and WAIT for Green Zone Buy Signals!

______________________________________________________________________________________________

LONG TERM INVESTMENTS  (not many Leaders have pulled back, and most Large Caps no longer have 80 Relative Strength required.)

Long Term Scrolling Charts (Real Time)

BNTX      BIO N TECH      Wait for the next Daily Money Wave Buy Signal.

CLF      CLEVELAND-CLIFFS INC.      Oct 26 Target Hit at $25.50 for a 15.6 % Gain.  

DKS      DICKS SPORTING GOODS        Wait for the next Daily Money Wave Buy Signal.

MT      ARCELOR METTAL SA     Wait for the next Daily Money Wave Buy Signal.

MRNA      MODERNA INC.      Wait for the next Daily Money Wave Buy Signal.

YETI      YETI HOLDINGS       Wait for the next Daily Money Wave Buy Signal.

______________________________________________________________________________________

My Trading Dashboard
Swing Trading Scrolling Charts
Day Trading Scrolling Charts

Click for  Watch Lists
Click for  Current Positions
Click for  Closed Positions

Updated Top 100 List Oct 1, 2021
Dividend Growth Portfolio  
ETF Sector Rotation System      
Dogs of the DOW System
Long Term Strategy for IRAs & 401k Plans
CNN Fear & Greed Index
Scrolling Stage Chart Investing Charts

Alert! Market Risk is MEDIUM (Yellow Zone). The probability of successful Short Term Trades is better, when the % of stocks above the 50-day avg. is below 20. 

Tell your Friends about the Green Line, and Help Animals.

______________________________________________________________________________________     

QUESTION: Jackie writes “Been reading your informative articles and FAQs.  Is there a way I can enter a stock such as BA or an ETF symbols and see them shown as AGL chart with red/green zones, MAs, sector ranking, Green Line etc?”

ANSWER:  Yes. Near the bottom of each Daily email, look for: ARE YOUR INVESTMENTS ABOVE THE GREEN LINE?

Please Click on the link (To make the Chart larger, please change the SIZE to Landscape and then Update.) 

Good trading and tell your friends!

Related Post

– Green Line Weekly Oct 24, 2021

Subscribe to Our Newsletter

AGL Logo

Get our eBook Now!

Candlestick - A Swing Traders Friend

We don’t spam! Read our privacy policy for more info.

You’ve been successfully subscribed to our newsletter!

Voted #1 at Stock Charts

SH Chart
Inverse S&P 500 Fund (SH) will have a Money Wave Buy today.

Help Us Help Animals

Help Us Help Animals

Recent Comments

  • Market Breadth Indicators: A Trader’s Guide to Early Trend Detection on Backtesting: Definition and How a Trading Strategy Backtest Works
  • Island Reversal Pattern: Definition and Formation Explained on Double Top Pattern: How to Identify and Trade This Reversal Signal
  • Channel Pattern Guide: What It Is and Why It Matters on A Guide to Forecasting Using Moving Averages
  • What Is a Broadening Bottom Chart Pattern? Full Guide on Bull vs. Bear Market: An Investor’s Guide to Market Phases
  • ATGL Weekly Money Flow - 2025-05-11 on ATGL Top Pick of the Week! Apr 6, 2025

Become a Green Liner!

Help me make more Money in the Stock Market.

ON ATGL

  • DashBoard
  • Weekly Commentary
  • Daily Buy / Sell Signals
  • Day Trade Setup
  • Trading Rooms

Design & Develop By Pixelvect

STRATEGIES

  • Swing Trading
  • ATGL Pick of the Week
  • Dividend Growth
  • ETF Sector Rotation
  • Dogs of the Dow

HELP

  • ATGL Trading Rules
  • FAQ
  • Account Maintenance
  • Contact US
  • Join

FOLLOW US

Instagram Linkedin Twitter Facebook

© COPYRIGHT 2024 · ABOVETHEGREENLINE.COM · ALL RIGHTS RESERVED · PRIVACY · TERMS · CONTACT · WATCHLIST · CURRENT