
10/30/2022 Markets were sharply higher again this week as the Indices are finally moving back up towards the Green Lines (like they always do). The Markets were very over sold last month and successfully flushed out the “weak hands” on FEAR. Notice how the Fear has quickly disappeared as the Media has turned more positive.
The FED is supposed to raise short term Interest Rates another 3/4 point on Wednesday, and that might be the last raise. Commodity prices have been falling as the FED has probably OVER-TIGHTENED. This FED Tightening has caused the US Dollar and long term Interest Rates to stretch Way Above the Green Lines. Eventually both will return near the Green Lines, when the Economy slows down more.
Stocks & Bonds are Way Below the Green Lines on FEAR. The Fear will eventually subside and these Investments will eventually return near their Green Lines.
If you continue to Follow the Green Line System, your Money should flow into the Strongest areas and your account value should be able to grow in both Bull and Bear Markets.
________________________________________________________________________________________________________________________________________________
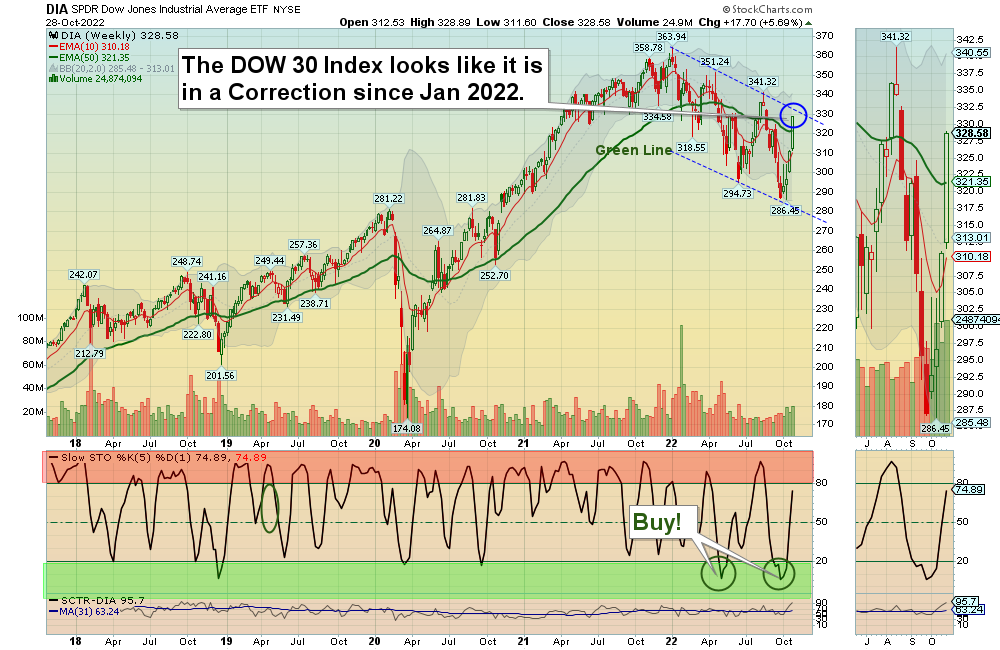
For the week the Dow was up 5.69%, the S&P 500 was up 3.94%, and the NASDAQ 100 up 2.11%. Currently the major Stock Indices are Below the Green Lines and have low Relative Strength (own stronger Securities here).
The Inflation Index (CRB) was up 0.10% for the week and is Below the Green Line, indicating Economic Contraction.
Bonds were up 3.90 % for the week, and are Below the Green Line, indicating Economic Expansion.
The US DOLLAR was down 1.23% for the week and is Way Above the Green Line.
Crude Oil was up 3.35% for the week at $87.90 and GOLD was down 0.65% at $1644.80.
More action this week on the Day Trading Scrolling Charts.
DAY TRADING CHARTS FOR INDICES & LARGE CAPS.
We have not had many intra-day Trade Alert signals lately as the Volume has been too Low with the Buy Signals. These low Volume Buy Signals tend to pop up and quickly fade back down. We like to see High Volume on rallies.
_____________________________________________________________________________________________
MONEY WAVE BUYS SOON:
We are in now in 9 logged Current Positions for the Short & Medium Term. There are 4 investments on the Short Term Watch List.
Be patient and WAIT for Green Zone Buy Signals!
LONG TERM INVESTMENTS: (Hard to find many Long Term now because most normal Investments no longer have 80 Relative Strength required.)
Long Term Scrolling Charts (Real Time)
BLU BELLUS HEALTH Buy if it Closes above $13.32 with High Volume.
CTIC CTI BIOPHARMA Up 11% this week, but the Volume was not high. Buy above $5.21 with High Volume.
DLTR DOLLAR TREE INC. Up 10% this week as it Closed above $146.17 with average Volume.
ENPH ENPHASE ENERGY Up 21% this week as for Weekly Money Wave Closed> 20. Avoid at this level now.
SIGA SIGA TECH. Wait for Weekly Money Wave Close > 20 with High Volume.
VIPS VIPSHOP HOLDINGS Buy if it Closes above $13.32 with High Volume. (now in nice Stage 1 Base).
______________________________________________________________________________________________________
My Trading Dashboard
Swing Trading Scrolling Charts
Day Trading Scrolling Charts
Click for Watch Lists
Click for Current Positions
Click for Closed Positions
Updated Top 100 List Oct 1, 2022
Dividend Growth Portfolio
Updated ETF Sector Rotation System
Dogs of the DOW System
Long Term Strategy for IRAs & 401k Plans
CNN Fear & Greed Index
Scrolling Stage Chart Investing Charts
Alert! Market Risk is Medium (YELLOW). The probability of successful Short Term Trades is better, when the % of stocks above the 50-day avg. is below 20.
Tell your Friends about the Green Line, and Help Animals.
________________________________________________________________________________
4 Ways to Get your Daily Money Wave Email Alert:
-
- Emailed to your box between 3:45 – 3:50 pm EST.
- Website menu Commentary/Buy/Sell Signals
- Twitter notifications are the fastest @AboveGreenLine
- Text messages: Email us your Cell number & phone carrier.
Thank you,
ATGL