
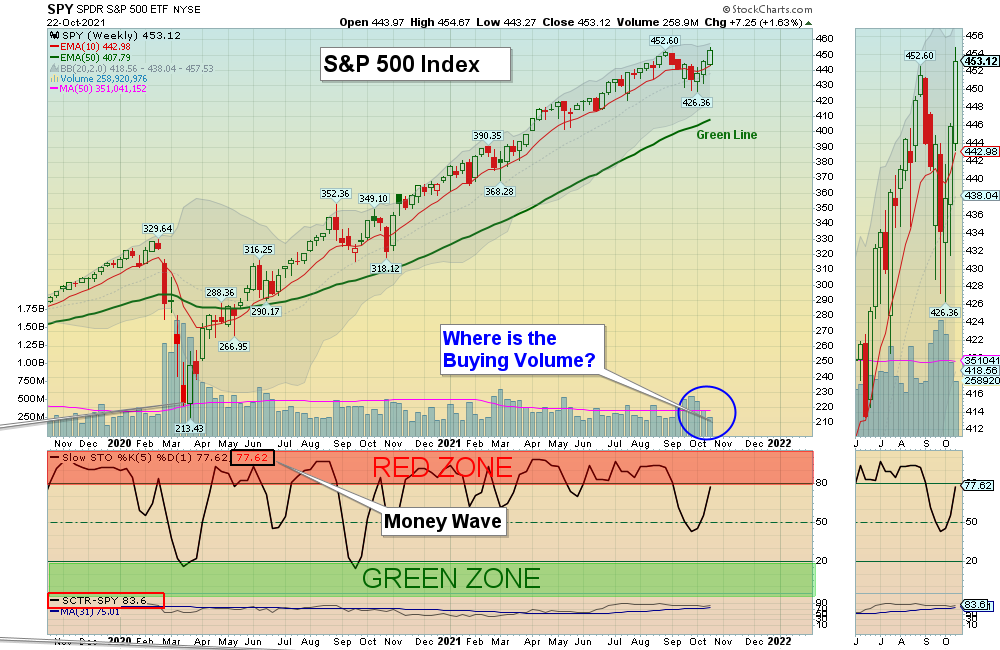
10/24/2021 Markets were higher again this week, as the major Indices are back up to the September Highs. The Financial and Oil & Gas Funds made much Higher Highs along with few Large Caps. But many Stocks are lower than in September. For the rally that began at the March 2020 Lows to continue, the Indices must make New Highs + High Volume. Otherwise we could see a “Double Top” which could bring in Selling.
The Markets are waiting on 1. Earnings that are now coming out, 2. Possibly Trillions more of Gov’t. Spending and 3. Expected FED Tapering of their $120 Billion of monthly Debt Buying in November. So Investors will be tested very soon to see how much new money is left to enter the Markets on Good or Bad News. No predicting here, we just Follow the Money.
If you continue to Follow the Green Line System, your Money should flow into the Strongest areas and your account value should be able to grow in both Bull and Bear Markets.
For the week the Dow was up 1.10%, the S&P 500 was up 1.63%, and the NASDAQ 100 was up 1.40%. The Long Term Trend for the Indices is up.
The Inflation Index (CRB) was down 0.67% for the week and is Above the Green Line, indicating Economic Expansion.
Bonds were down 0.62% for the week, and are back Below the Green Line, indicating Economic Expansion.
The US DOLLAR was down 0.33% for the week and is Above the Green Line.
Crude Oil was up 2.48% for the week at $83.76 (a New High) and GOLD was up 1.58% at $1796.30.
_____________________________________________________________________________________________
MONEY WAVE BUYS SOON
We are currently in only 1 logged Current Positions, for the Short & Medium Term (Most Leaders are up in the Red Zones). There are 5 investments on the Short Term Watch List.
Be patient and WAIT for Green Zone Buy Signals!
______________________________________________________________________________________________
LONG TERM INVESTMENTS (not many Leaders have pulled back, and most Large Caps no longer have 80 Relative Strength required.)
Long Term Scrolling Charts (Real Time)
BNTX BIO N TECH Wait for the next Daily Money Wave Buy Signal.
CLF CLEVELAND-CLIFFS INC. Closed above the Red Line (50-day avg.) on Friday with High Volume and was bought.
DKS DICKS SPORTING GOODS Wait for the next Daily Money Wave Buy Signal.
MT ARCELOR METTAL SA Wait for the next Daily Money Wave Buy Signal.
MRNA MODERNA INC. Wait for the next Daily Money Wave Buy Signal.
YETI YETI HOLDINGS Wait for the next Daily Money Wave Buy Signal.
______________________________________________________________________________________
My Trading Dashboard
Swing Trading Scrolling Charts
Day Trading Scrolling Charts
Click for Watch Lists
Click for Current Positions
Click for Closed Positions
Updated Top 100 List Oct 1, 2021
Dividend Growth Portfolio
ETF Sector Rotation System
Dogs of the DOW System
Long Term Strategy for IRAs & 401k Plans
CNN Fear & Greed Index
Scrolling Stage Chart Investing Charts
Alert! Market Risk is MEDIUM (Yellow Zone). The probability of successful Short Term Trades is better, when the % of stocks above the 50-day avg. is below 20.
Tell your Friends about the Green Line, and Help Animals.
______________________________________________________________________________________
QUESTION: Praveen writes “I am not receiving intra-day alerts for the buy and sell I am just getting end of day email. can you help?”
Thanks.
ANSWER: We currently have 1 email going out Daily, the Money Wave Alert! which is sent between 3:40 -3:50 EST. Most members do best with Swing Trading (3 days to 3 weeks trade) than with Day Trading (most Day Traders lose money because they don’t have a System).
We are sending out some Day Trading Tweets to subscribers on a free Twitter account @AboveGreenLine (please set up your Twitter account for mobile notifications).
But most subscribers follow the Swing Trading Scrolling Charts and Day Trading Scrolling Charts Lists during the day, as they are constantly being updated.
We are have Live Streaming on YouTube, which has these current Watch Lists running “real time”.
Thank you for writing,
ATGL


