
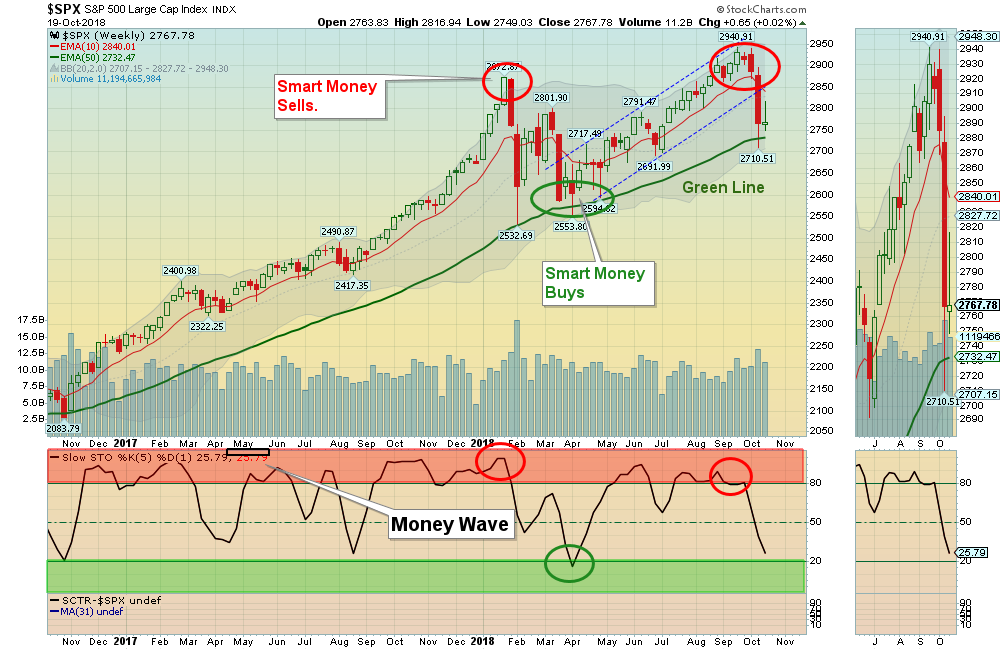
10/21/2018: Markets were up slightly for the week, as the S&P 500 is going back down to re-test the Green Line. Bouncing before the Green Line would be “Bullish”. Then possibly a larger rally up for the Leaders.
Now the Indices are back down near the Green Zones, for Money Wave Buys soon.
Weaker Investments might not bounce that well, so only Buy the Strongest Investments with > 90 Relative Strength.
For the week the Dow was up 0.41%, the S&P 500 was up 0.11%, and the Nasdaq 100 was down 0.70%. The Long Term Trend on the Stock Markets is UP.
The Inflation Index (CRB) was down 0.39% and is Above the Green Line, indicating Economic Strength.
Bonds were down 0.66% for the week and are Below the Green Line, indicating Economic Strength.
The US DOLLAR was up 0.55% for the week, but it has resistance at the August Highs.
Crude Oil was down 2.89% for the week at $69.28, and GOLD was up at $1229.
___________________________________________________________________________________________
MONEY WAVE BUYS SOON:
We are currently in 11 logged Open Positions, for the Short & Medium Term. There are 8 Investments on the Short Term Watch List.
Be patient and WAIT for Green Zone Buys!
______________________________________________________________________________________________
LONG TERM TRADES
The Long Term List has become large, and if the Investments below can Bounce up off the Green Line with Above 80 Relative Strength, some could re-test their Highs.
AEO AMER. EAGLE OUTFITTERS Wait for weekly Close Above the Red Line of $23.82 (50-day avg.)
ALGN ALIGN TECH
ARWR ARROWHEAD PHARMA.
CVNA CARVANA CO. Wait for weekly Close Above the Red Line of $54.31 (50-day avg.)
FDN INTERNET FUND
FOSL FOSSIL GROUP Wait for weekly Close Above the Red Line of $23.12 (50-day avg.)
HEAR TURTLE BEACH CORP. Wait for weekly Close Above the Red Line of $21.40 (50-day avg.)
HRTX HERON THERA. Wait for weekly Close Above the Red Line of $33.49 (50-day avg.)
IMMU IMMUNOMEDICS, INC. Wait for a Fade back down to the 50-day avg.
M MACY’S INC. Wait for weekly Close Above the Red Line of $35.04 (50-day avg.)
URBN URBAN OUTFITTERS Wait for weekly Close Above the Red Line of $42.04 (50-day avg.)
WTW WEIGHT WATCHERS Wait for weekly Close Above the Red Line of $72.94 (50-day avg.)
___________________________________________________________________________________________
Click for Portfolio (Open Positions)
Click for Watch List
Click for Closed Positions
Alert! Market Risk is LOW (Green Zone). The probability of successful Short Term Trades is better, when the S&P 500 is down near the Green Line.
Tell your Friends about the Green Line, and Help Animals.


