
10/07/2018: Markets dumped for the week, as the S&P 500 could not HOLD above the Support of the January Highs of 2872. This makes the Jan & Sept Highs more of a “Double Top” (no more Money), at least for the short term.
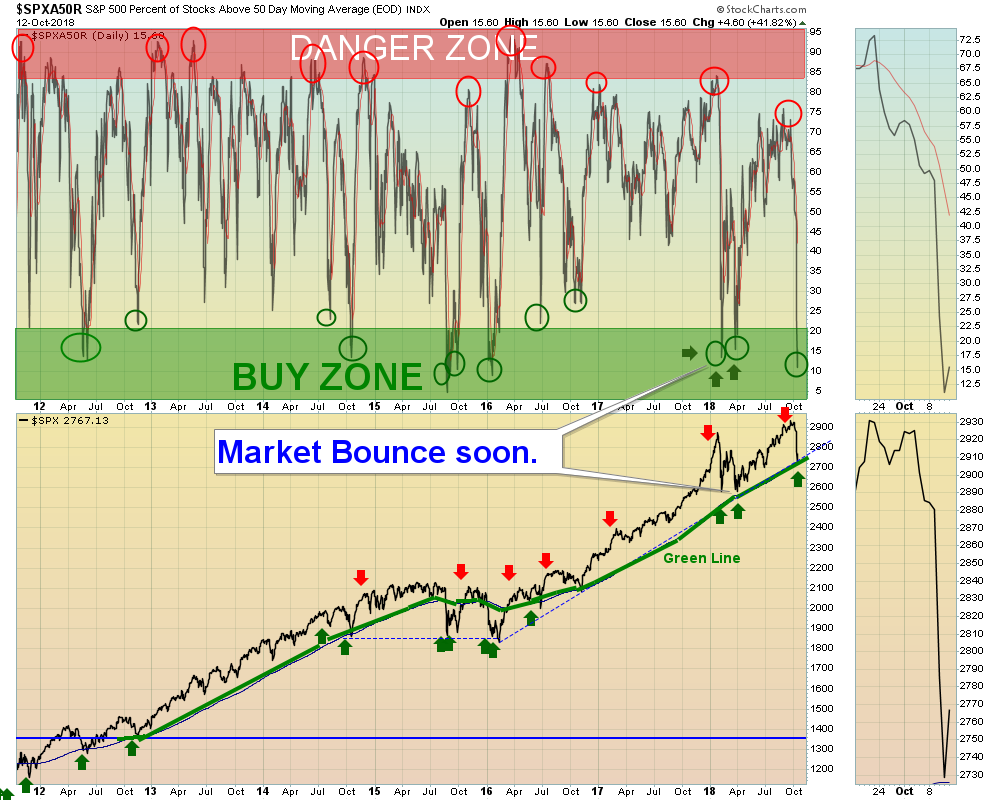
However, now only 16% of the S&P 500 Stocks are Above the 50-day avgs. which has created good Buying points in the past (see chart above). Remember, Sell when the Herd feels Great, Buy when the Herd is scared. Maybe another quick re-test back down next week towards the Green Line, and then a larger rally up for the Leaders.
Now the Indices are back down in the Green Zones, for Money Wave Buys soon.
Weaker Investments might not bounce that well, so only Buy the Strongest Investments with > 90 Relative Strength.
For the week the Dow was down 4.19%, the S&P 500 was down 4.10%, and the Nasdaq 100 was down 3.27%. The Long Term Trend on the Stock Markets is UP.
The Inflation Index (CRB) was down 0.55% and is Above the Green Line, indicating Economic Strength.
Bonds were up 1.27% for the week and are Below the Green Line, indicating Economic Strength.
INVERSE BOND FUND TBT could be beginning a BULL Market, as it is Above the Green Line + 90 Relative Strength. However, TBT is very Over-Bought.
The US DOLLAR was up 0.55% for the week, but it has resistance at the August Highs.
Crude Oil was down 4.04% for the week at $71.34, and GOLD was up at $1222.
___________________________________________________________________________________________
MONEY WAVE BUYS SOON:
We are currently in 8 logged Open Positions, for the Short & Medium Term. There are 5 Investments on the Short Term Watch List.
Be patient and WAIT for Green Zone Buys!
______________________________________________________________________________________________
LONG TERM TRADES
The Long Term List has become large, and if the Investments below can Bounce up off the Green Line with Above 80 Relative Strength, some could re-test their Highs.
AEO AMER. EAGLE OUTFITTERS Wait for weekly Close Above the Red Line of $23.82 (50-day avg.)
CVNA CARVANA CO. Wait for weekly Close Above the Red Line of $54.31 (50-day avg.)
ECYT ENDOCYTE, INC. Wait for weekly Close Above the Red Line of $16.73 (50-day avg.)
FOSL FOSSIL GROUP Wait for weekly Close Above the Red Line of $23.12 (50-day avg.)
HEAR TURTLE BEACH CORP. Wait for weekly Close Above the Red Line of $21.40 (50-day avg.)
HRTX HERON THERA. Wait for weekly Close Above the Red Line of $33.49 (50-day avg.)
IMMU IMMUNOMEDICS, INC. Wait for weekly Close Above the Red Line of $22.07 (50-day avg.)
M MACY’S INC. Wait for weekly Close Above the Red Line of $35.04 (50-day avg.)
THC TELNET HEALTHCARE Wait for weekly Close Above the Red Line of $29.58 (50-day avg.)
TWTR TWITTER, INC. Wait for weekly Close Above the Red Line of $30.90 (50-day avg.)
URBN URBAN OUTFITTERS Wait for weekly Close Above the Red Line of $42.04 (50-day avg.)
WTW WEIGHT WATCHERS Wait for weekly Close Above the Red Line of $72.94 (50-day avg.)
___________________________________________________________________________________________
Click for Portfolio (Open Positions)
Click for Watch List
Click for Closed Positions
Alert! Market Risk is LOW (Green Zone). The probability of successful Short Term Trades is better, when the S&P 500 is down near the Green Line.
Tell your Friends about the Green Line, and Help Animals.
QUESTION: Stan writes ” Do you ever Sell Investments Short?”
ANSWER: Hi Stan, as long at the major Indices are in up-trends we will not Short, as most Followers don’t understand Selling Short.
Just recently there are 2 Inverse Funds that now meet the Green Line Rules (Above the Green Line + Above 90 Relative Strength).
They are Inverse Emerging Markets (EUM) and Inverse Ultra Bond Fund (TBT). Both are currently too over-bought now, but they should be on the Watch List soon if they still meet the Rules.


