
10/15/2023 Markets shot up earlier this week and the S&P 500 rallied up to the 50-day avg. (like it always does). Then the Indices became over bought for the short term (back up in the Red Zones), and are pulling back on profit taking. The Strongest Leaders are holding up fine above the 10-day averages.
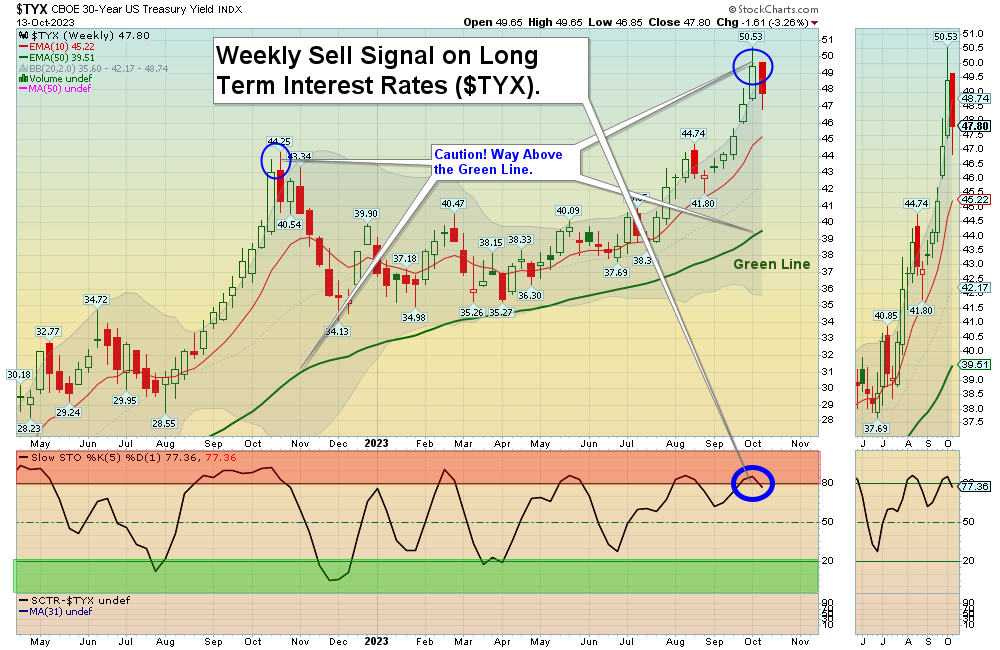
The S&P 500 Index had a 4.1% bounce up off of the Green Line, after the Media tried to Flush out the Dumb Money that bought at the August highs on GREED & FOMO (Fear of Missing Out). Now Stocks need for T-Bonds to put in a good bottom and bounce up. Eventually Bonds will meet again with the Green Line, when the FEAR subsides. Then we should see the Stock Indices go up on Wave 5 to retest the August high.
If you continue to Follow the Green Line System, your Money should flow into the Strongest areas and your account value should be able to grow in both Bull and Bear Markets. Follow the MONEY, not the MEDIA.
_____________________________________________________________________________________________
For the week the Dow was up 0.77%, the S&P 500 was up 0.46% and the NASDAQ 100 was up 0.16%. Many of the major Indices still have a Relative Strength below 80, so you should currently own the stronger Funds here.
The Inflation Index (CRB) was up 2.55% for the week and is Above the Green Line, indicating Economic Expansion.
Bonds were up 3.33% for the week, and are Below the Green Line, indicating Economic Expansion.
The US DOLLAR was up 0.61% for the week and is Above the Green Line.
Crude Oil was up 5.92% for the week at $87.69 and GOLD was up 5.22% at $1941.50.
_____________________________________________________________________________________
We are doing many micro Day Trades on our new Discord site (free). Please join Discord on your cell phone app for day trading mobile notifications during the day. Other methods of notification have been too slow. Also, please check our our Live Streaming on YouTube during Market hours.
More action this week on the Day Trading Scrolling Charts, and Day Trading Charts for Indices & Large Caps.
_____________________________________________________________________________________________
MONEY BUYS SOON:
We are in now in 10 logged Swing Trading Positions (fully invested) for the Short & Medium Term. There are 4 investments on the Short Term Watch List.
Be patient and WAIT for Green Zone Buy Signals!
LONG TERM INVESTMENTS:
Long Term Scrolling Charts (Real Time)
AI C3 AI INC. Buy above $30.08 with High Volume with a 3% Trailing Sell Stop Loss below it.
BLDR BUILDERS FIRSTSOURCE Wait for next Weekly Money Wave Close > 20 with High Volume.
GBTC GRAYSTONE BITCOIN FUND Buy above $21.10 with High Volume with a 3% Trailing Sell Stop Loss below it.
ITB HOME BUILDING FUND Wait for next Weekly Money Wave Close > 20 with High Volume.
ORCL ORACLE CORP. Wait for next Weekly Money Wave Close > 20 with High Volume.
PINS PINTEREST INC. Buy above $30.86 with High Volume with a 3% Trailing Sell Stop Loss below it.
SH INVERSE S&P 500 FUND Buy above $17.71 with High Volume with a 3% Trailing Sell Stop Loss below it.
TAL TAL EDUCATION GROUP Buy above $10.45 with High Volume with a 3% Trailing Sell Stop Loss below it.
WW WEIGHT WATCHERS INT’l. Buy above $12.13 with High Volume with a 3% Trailing Sell Stop Loss below it.
__________________________________________________________________________________________
My Trading Dashboard
Swing Trading Scrolling Charts
Day Trading Scrolling Charts
Click for Watch Lists
Click for Current Positions
Click for Closed Positions
Updated Top 100 List Oct 1, 2023
Dividend Growth Portfolio
Updated ETF Sector Rotation System
Dogs of the DOW System
Long Term Strategy for IRAs & 401k Plans
CNN Fear & Greed Index
Scrolling Stage Chart Investing Charts
Alert! Market Risk is Low (GREEN). The probability of successful Short Term Trades is better, when the % of stocks above the 50-day avg. is below 20.
Tell your Friends about the Green Line, and Help Animals.
________________________________________________________________________________
QUESTION: Jeff writes “Hello, in trying to understand your “DONT TAKE A LOSS” comments. Why don’t you raise the stop loss when the stock pops up so much? I am not capturing a lot of upside, as I wait and get out conservatively. Is the point to let them run with a large stop loss to capture maximum upside?
ANSWER: Hi Jeff. When a Stock is really running, having a Stop below the Pink Line usually works well. But sometimes they “Gap Up” way above all averages. There is no correct answer, except that we know that the Investment will eventually return to all of the averages. Try to judge if the Market is very Strong or not…
In the current Market, we are capturing smaller Gains… Holding on for more could be determined by calculating the Reward / Risk ratio of 2:1. (Can it go up $4 more with downside of only $2?) Also some members want to see more longer term results by strictly following the Rules.
When the Money Wave > 50, then the Stop is raised to the Buy Price. (Don’t Take a Loss!). Probability says to “Get Out Even” and wait for the next trade.
Thanks for writing.
ATGL
Related Post
– AI


