
11/6/2022 Markets were lower for the week as the Indices became over-bought after a 12% rally off of the October lows. The FED raised short term Interest Rates another 3/4 point this week, but that might be the last raise. This tightening by the FED caused some FEAR Selling on the Big Tech Stocks. We are waiting for the US Dollar and long term Interest Rates to come back down near the Green Lines, which should help both Stocks and Bonds.
Stocks & Bonds are Way Below the Green Lines on FEAR. The Fear should eventually subside and these Investments will eventually return back up near their Green Lines.
If you continue to Follow the Green Line System, your Money should flow into the Strongest areas and your account value should be able to grow in both Bull and Bear Markets.
________________________________________________________________________________________________________________________________________________
For the week the Dow was down 1.35%, the S&P 500 was down 3.26%, and the NASDAQ 100 down 5.88%. Currently the major Stock Indices are Below the Green Lines and have low Relative Strength (own stronger Securities here).
The Inflation Index (CRB) was up 5.48% for the week and is Above the Green Line, indicating Economic Expansion.
Bonds were down 2.43% for the week, and are Below the Green Line, indicating Economic Expansion.
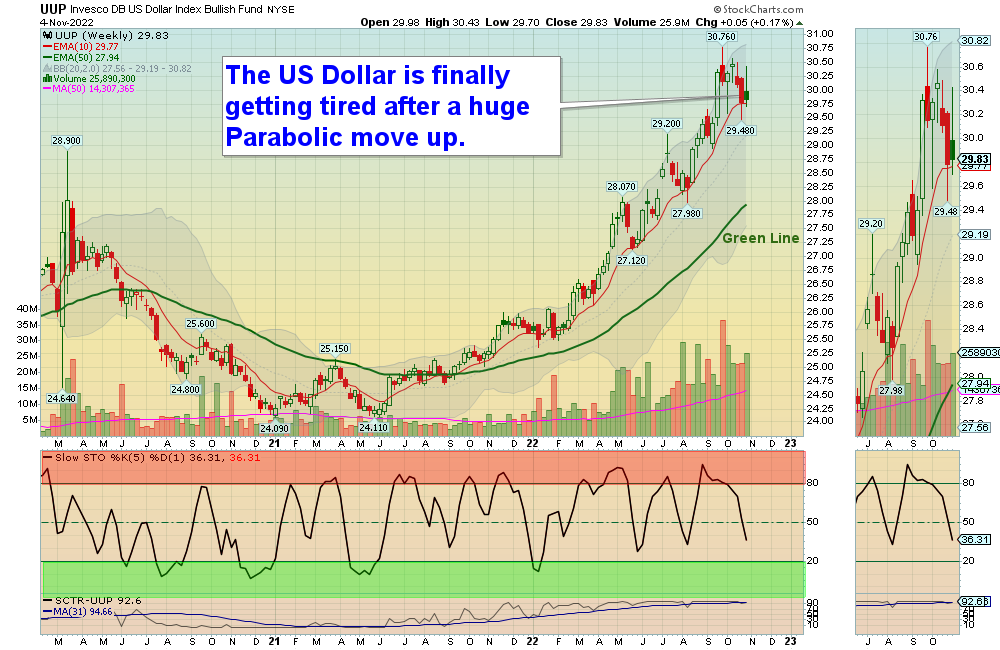
The US DOLLAR was up 0.15% for the week and is Way Above the Green Line.
Crude Oil was up 5.36% for the week at $92.61 and GOLD was up 1.93% at $1676.60.
More action this week on the Day Trading Scrolling Charts.
DAY TRADING CHARTS FOR INDICES & LARGE CAPS.
We have not had many intra-day Trade Alert signals lately as the Volume has been too Low with the Buy Signals. These low Volume Buy Signals tend to pop up and quickly fade back down. We like to see High Volume on rallies.
_____________________________________________________________________________________________
MONEY WAVE BUYS SOON:
We are in now in 10 logged Current Positions for the Short & Medium Term. There are 2 investments on the Short Term Watch List.
Be patient and WAIT for Green Zone Buy Signals!
LONG TERM INVESTMENTS: (Hard to find many Long Term now because most normal Investments no longer have 80 Relative Strength required.)
Long Term Scrolling Charts (Real Time)
BLU BELLUS HEALTH Buy if it Closes above $9.84 with High Volume.
CTIC CTI BIOPHARMA Closed above $5.21 but the Volume was not High. Maybe Buy around $5.05.
SIGA SIGA TECH. Weekly Money Wave Closed > 20, but the Volume was not high. AVOID.
VIPS VIPSHOP HOLDINGS Buy if it Closes above $13.32 with High Volume. (now in Stage 1 Base).
______________________________________________________________________________________________________
My Trading Dashboard
Swing Trading Scrolling Charts
Day Trading Scrolling Charts
Click for Watch Lists
Click for Current Positions
Click for Closed Positions
Updated Top 100 List Nov 1, 2022
Dividend Growth Portfolio
Updated ETF Sector Rotation System
Dogs of the DOW System
Long Term Strategy for IRAs & 401k Plans
CNN Fear & Greed Index
Scrolling Stage Chart Investing Charts
Alert! Market Risk is Medium (YELLOW). The probability of successful Short Term Trades is better, when the % of stocks above the 50-day avg. is below 20.
Tell your Friends about the Green Line, and Help Animals.
________________________________________________________________________________
QUESTION: John C. writes “Hi. I have been using your methods with quite good success over the past year, but lately I have been wondering something. Sometimes you post a daily chart for a company, but other times you post a weekly chart. For swing/momentum trading, which chart is best to go by, because looking at both, side to side, the Money Waves are quite different.
Many thanks, John C.
ANSWER: Hi John. The Green Line System is based on Buying the Leaders in the Green Zone, and taking Profits in the Red Zone.
The Daily Chart cycle usually takes 1-3 weeks and the Weekly Chart takes 1-3 months. If you Buy the Weekly, don’t look at the Daily, as the Daily will cycle thru many times and be confusing. Pick only 1 Time Frame, and stick with it.
Many will use a shorter term Time Frame for ENTRY only, then go back to your Main Chart decision.
Thanks for writing.
ATGL
Related Post
– BLU


