
11/05/2023 Markets were sharply higher for the week, as long term Interest Rates fell from 5.1% to 4.7%. Longer term the Interest Rates should meet again with the Green Line around 4%, but Rates might have to pop up once more to retest the recent highs.
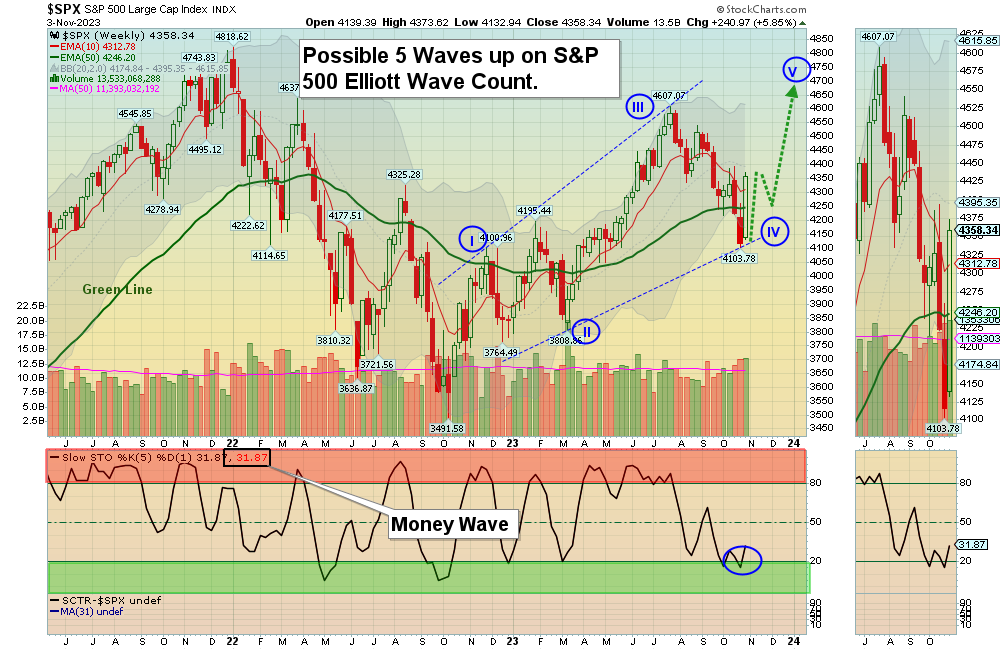
Stocks got the rally needed from T-Bonds after finishing the Wave 4 down correction since the August highs. So this week’s rally should be wave 1 up of the Fifth Wave, back up to retest the August highs. We will normally have a wave 2 down soon which might lose about 1/2 of the recent gain. So we could stop out of some Buy Positions that were bought too early (or too high) on the decline. This would be to raise CASH and try to Buy them lower. Please check the Current Positions page and tighten your Sell Stop Losses if you are nervous about the Stock Market. Then if there is a successful wave 2 pull back there could be a big wave 3 up (maybe 10%) to retest the August high.
If you continue to Follow the Green Line System, your Money should flow into the Strongest areas and your account value should be able to grow in both Bull and Bear Markets. Follow the MONEY, not the MEDIA.
The Strongest Funds now are NASDAQ 100 (QQQ), Uranium Fund (URA), Greed Fund (SVIX), Inverse Bond Fund (TBT), Inverse Small Cap Fund (RWM), Semiconductor Fund (SMH) & BitCoin Fund (GBTC). If you don’t own any of these, then next year could be painful for your investment portfolio… Smart Money rotates.
_____________________________________________________________________________________________
For the week the Dow was up 5.06%, the S&P 500 was up 5.85% and the NASDAQ 100 was up 6.49%. Many of the major Indices still have a Relative Strength below 80, so you should currently own the stronger Funds here.
The Inflation Index (CRB) was down 1.17% for the week and is Above the Green Line, indicating Economic Expansion.
Bonds were up 4.22% for the week, and are Below the Green Line, indicating Economic Expansion.
The US DOLLAR was down 1.43% for the week and is Above the Green Line.
Crude Oil was down 5.88% for the week at $80.51 and GOLD was up 0.04% at $1999.20.
_____________________________________________________________________________________
We are doing many micro Day Trades on our new Discord site (free). Please join Discord on your cell phone app for day trading mobile notifications during the day. Other methods of notification have been too slow. Also, please check our our Live Streaming on YouTube during Market hours.
More action this week on the Day Trading Scrolling Charts, and Day Trading Charts for Indices & Large Caps.
_____________________________________________________________________________________________
MONEY BUYS SOON:
We are in now in 10 logged Swing Trading Positions for the Short & Medium Term. There are only 2 investments on the Short Term Watch List.
Be patient and WAIT for Green Zone Buy Signals!
LONG TERM INVESTMENTS: SOME BIG POPS THIS WEEK!
Long Term Scrolling Charts (Real Time)
AFRM AFFIRM HOLDINGS Buy above $25.63 with High Volume with a 3% Trailing Sell Stop Loss below it.
AI C3 AI INC. Buy above $30.08 with High Volume with a 3% Trailing Sell Stop Loss below it.
BLDR BUILDERS FIRSTSOURCE Shot up 19 % on the weekly Buy Signal. Tight Sell Stop.
ITB HOME BUILDING FUND Shot up 13 % on the weekly Buy Signal. Tight Sell Stop.
ORCL ORACLE CORP. Shot up 7 % on the weekly Buy Signal.
PINS PINTEREST INC. Closed slightly above $30.86 Resistance. Watch for next week.
RWM INVERSE SMALL CAP FUND Buy above $26.55 with High Volume with a 3% Trailing Sell Stop Loss below it.
SVIX INVERSE VIX FUND (Greed Index) Shot up 26 % on the weekly Buy Signal. Tight Sell Stop.
TAL TAL EDUCATION GROUP Buy above $10.45 with High Volume with a 3% Trailing Sell Stop Loss below it.
__________________________________________________________________________________________
My Trading Dashboard
Swing Trading Scrolling Charts
Day Trading Scrolling Charts
Click for Watch Lists
Click for Current Positions
Click for Closed Positions
Updated Top 100 List Nov 1, 2023
Dividend Growth Portfolio
Updated ETF Sector Rotation System
Dogs of the DOW System
Long Term Strategy for IRAs & 401k Plans
CNN Fear & Greed Index
Scrolling Stage Chart Investing Charts
Alert! Market Risk is Medium (YELLOW). The probability of successful Short Term Trades is better, when the % of stocks above the 50-day avg. is below 20.
Tell your Friends about the Green Line, and Help Animals.
________________________________________________________________________________
QUESTION: How can I check my other Investments to see if they meet the Green Line Rules?
ANSWER: Please Click on the StockChart link here and on the website Main Menu under DashBoard / StockCharts.
Please input the Symbol of your Investment in the top left and click “Update”. For LARGER CHARTS, scroll down below the Chart to change the Size to Landscape, and then Click on the “Update” button).
The Relative Strength value in on the bottom left of the Chart labeled SCTR.
Related Post
– AI


