
11/19/2023 Markets were higher for the week, as the long term Interest Rates fell more, and Bonds went higher. But long term Interest Rates should go up once more to retest the recent 5.1% Rate. Then if Rates Double Top or make a lower high, longer term Interest Rates should fall and meet again with the Green Line around 4%.
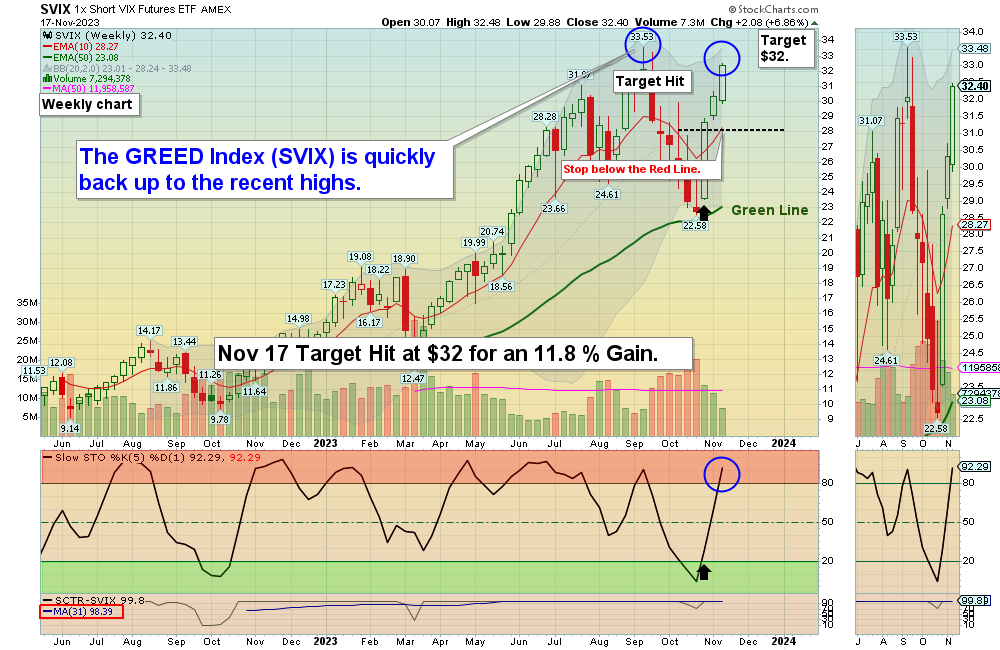
Stocks should be about to finish wave 1 up of the Fifth Wave, back up to retest the August highs. Normally this Fifth Wave should have 5 smaller waves in it (3 up and 2 down). but this rally is so large that the current Wave count is uncertain. The Strongest Indices QQQ SMH SVIX are quickly back up near the recent highs (Resistance). After that, normally there will be a wave 2 down which might lose about 1/2 of the recent gain. So we have taken profits on several Buy Positions below, maybe before they get Stopped Out on the next pull back. This could be a chance to raise CASH and try to Buy them lower for nimble investors. Please check the Current Positions page and tighten your Sell Stop Losses if you are nervous about the Stock Market.
If you continue to Follow the Green Line System, your Money should flow into the Strongest areas and your account value should be able to grow in both Bull and Bear Markets. Follow the MONEY, not the MEDIA.
_____________________________________________________________________________________________
Recent Trade Targets that were Hit:
AAOI Applied OptoElectronics Target was Hit for a 43.8% Gain.
ADBE Adobe Systems Target was Hit for a 7.1% Gain.
DELL DELL Tech. Target was Hit for an 8.8% Gain.
NVDA NVIDIA Corp. Target was Hit for a 12.9% Gain.
QQQ NASDAQ 100 Fund Target was Hit for a 6.8% Gain.
SMH Semiconductor Fund Target was Hit for a 10.8% Gain.
SVIX Greed Index Target was Hit for a 6.1% Gain, and 11.8% in the Long Term Portfolio.
UEC Uranium Energy Corp. Target was Hit for a 7.9% Gain.
_______________________________________________________________________________________________
For the week the Dow was up 2.08%, the S&P 500 was up 2.31% and the NASDAQ 100 was up 2.02%. Many of the major Indices still have a Relative Strength below 80, so you should currently own the stronger Funds here.
The Inflation Index (CRB) was up 0.10% for the week and is Below the Green Line, indicating Economic Contraction.
Bonds were up 2.33% for the week, and are Below the Green Line, indicating Economic Expansion.
The US DOLLAR was down 1.83% for the week and is Below the Green Line.
Crude Oil was down 1.46% for the week at $76.04 and GOLD was up 2.43% at $1984.70.
_____________________________________________________________________________________
We are doing many micro Day Trades on our new Discord Trading Hub (free). Please join Discord on your cell phone app for day trading mobile notifications during the day. Other methods of notification have been too slow. Also, please check our our Live Trading Room on YouTube during Market hours.
More action this week on the Day Trading Scrolling Charts, and Day Trading Charts for Indices & Large Caps.
_____________________________________________________________________________________________
MONEY BUYS SOON:
We are in now in 4 logged Swing Trading Positions for the Short & Medium Term. There are only 2 investments on the Short Term Watch List.
Be patient and WAIT for Green Zone Buy Signals!
LONG TERM INVESTMENTS:
Long Term Scrolling Charts (Real Time)
AFRM AFFIRM HOLDINGS Buy above $25.63 with High Volume with a 3% Trailing Sell Stop Loss below it.
AI C3 AI INC. Buy above $30.08 with High Volume with a 3% Trailing Sell Stop Loss below it.
PINS PINTEREST INC. Closed slightly above $30.86 Resistance, but is now back up in the weekly Red Zone. Watch for next week.
RIG TRANSOCEAN INC. Buy above $7.05 with High Volume with a 3% Trailing Sell Stop Loss below it.
RRPIX RISING RATE MUTUAL FUND Wait for next Weekly Money Wave Close > 20.
RWM INVERSE SMALL CAP FUND Buy above $26.55 with High Volume with a 3% Trailing Sell Stop Loss below it.
TAL TAL EDUCATION GROUP Buy above $10.45 with High Volume with a 3% Trailing Sell Stop Loss below it.
__________________________________________________________________________________________
My Trading Dashboard
Swing Trading Scrolling Charts
Day Trading Scrolling Charts
Click for Watch Lists
Click for Current Positions
Click for Closed Positions
Updated Top 100 List Nov 1, 2023
Dividend Growth Portfolio
Updated ETF Sector Rotation System
Dogs of the DOW System
Long Term Strategy for IRAs & 401k Plans
CNN Fear & Greed Index
Scrolling Stage Chart Investing Charts
Alert! Market Risk is Medium (YELLOW). The probability of successful Short Term Trades is better, when the % of stocks above the 50-day avg. is below 20.
Tell your Friends about the Green Line, and Help Animals.
________________________________________________________________________________
QUESTION: Jackie writes “Is there a way I can enter a stock such as BA or an ETF symbols and see them shown as ATGL chart with red/green zones, MAs, sector ranking, Green Line, etc?”
ANSWER: Yes. Near the bottom of each Daily email, look for: ARE YOUR INVESTMENTS ABOVE THE GREEN LINE?
Please Click on the link (To make the Chart larger, please change the SIZE to Landscape and then Update.)
Good trading and tell your friends!
Related Post
– AFRM