
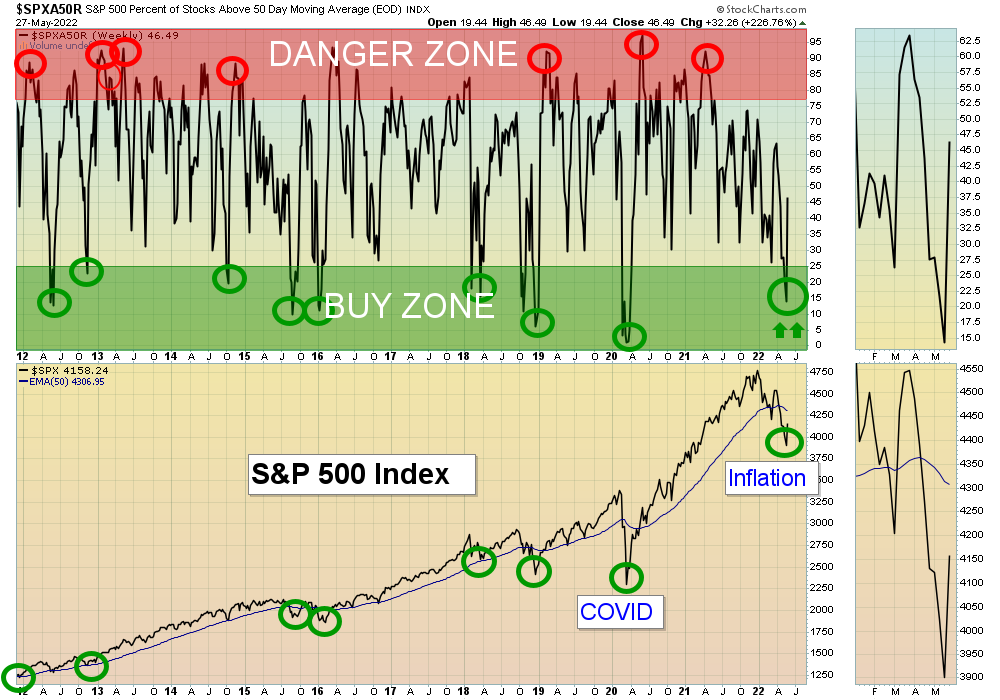
5/29/2022 Markets were up sharply for the week as the Indices were severely over-sold, and Smart Money Buys on the massive FEAR. Most were worried about high Interest Rates and Inflation, but now the Media is telling you that the worst is over (after Dumb Money sold from FEAR near the bottom with major losses).
The S&P 500 Index is already up 9.1 % from last week’s low, so expect a pause or pull back soon near the Red Line (50-day avg.). The US Dollar Fund (UUP) and Inverse T-Bonds Fund (TBF) are on the Watch List, so long term Interest Rates should pop up once more to re-test the recent Highs.
Currently the tangible Commodities are Way Above the Green Lines, and Bonds are Way Below the Green Lines. Both will eventually return to the Green Lines, so maybe we will see a Stock Market rally when Interest Rates and Inflation fall. (Big surprise for Dumb Money.)
If you continue to Follow the Green Line System, your Money should flow into the Strongest areas and your account value should be able to grow in both Bull and Bear Markets.
More action this week on the Day Trading Scrolling Charts.
DAY TRADING CHARTS FOR INDICES & LARGE CAPS.
We have not had many intra-day Trade Alert signals lately as the Volume has been too Low with the Buy Signals. These low Volume Buy Signals tend to pop up and quickly fade back down. We like to see High Volume on rallies.
For the week the Dow was up 6.29%, the S&P 500 was up 6.58%, and the NASDAQ 100 was up 7.07%. Currently the major Stock Indices are Below the Green Lines (AVOID and own stronger Investments).
The Inflation Index (CRB) was up 2.49% for the week and is Above the Green Line, indicating Economic Expansion.
Bonds were up 0.48% for the week, but are Way Below the Green Line, indicating Economic Expansion.
The US DOLLAR was down 1.43% for the week and is Way Above the Green Line.
Crude Oil was up 4.34% for the week at $115.07 and GOLD was up 0.83% at $1857.30.
_____________________________________________________________________________________________
MONEY WAVE BUYS SOON
We are in now in 7 logged Current Positions for the Short & Medium Term. There are 6 investments on the Short Term Watch List.
Be patient and WAIT for Green Zone Buy Signals!
_________________________________________________________________________________________
LONG TERM INVESTMENTS (Hard to find many Long Term now because most normal Investments no longer have 80 Relative Strength required.)
Long Term Scrolling Charts (Real Time)
AA ALCOA CORP. Up 6 % this week but Volume was not high. Wait for the next Daily Money Wave Buy Signal with High Volume.
ACI ALBERTSONS CO. Up 11 % this week. Wait for the next Daily Money Wave Buy Signal with High Volume.
LAC LITHIUM AMERICAS CORP. Up 14 % this week. Wait for the next Daily Money Wave Buy Signal with High Volume.
NUE NUCOR CORP. (Steel) Up 15 % this week. Wait for the next Daily Money Wave Buy Signal with High Volume.
RRPIX RISING INTEREST RATES FUND The Daily Money Wave Buy Signal is back down in the Green Zone. Will Buy soon.
_______________________________________________________________________________
My Trading Dashboard
Swing Trading Scrolling Charts
Day Trading Scrolling Charts
Click for Watch Lists
Click for Current Positions
Click for Closed Positions
Updated Top 100 List May 1, 2022
Dividend Growth Portfolio
Updated ETF Sector Rotation System
Dogs of the DOW System
Long Term Strategy for IRAs & 401k Plans
CNN Fear & Greed Index
Scrolling Stage Chart Investing Charts
Alert! Market Risk is Medium (YELLOW). The probability of successful Short Term Trades is better, when the % of stocks above the 50-day avg. is below 20.
Tell your Friends about the Green Line, and Help Animals.
________________________________________________________________________________
Do you want a new “Green Line” T-Shirt?
Email us your suggestion or comment for improving the ATGL service.
Then we will mail your T for worthy suggestions.
Thank you,
ATGL