
Watchlist and Charts to Buy Soon.
| Daily Swing Watch List | Daily Swing Charts to Buy |
| Current Swing Positions | Current Swing Charts |
| Closed Results | Trading Dashboard |
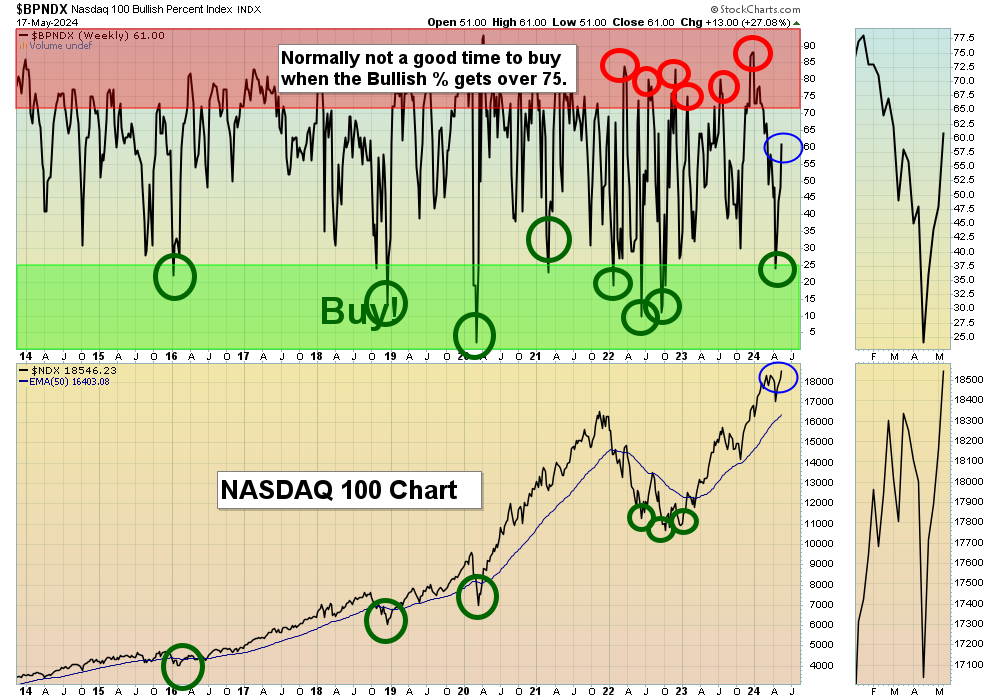
5/19/2024 Markets were higher again for the week as many are betting that Inflation has peaked. Bonds rallied higher (lower long term Rates) on slower Inflation news. The strongest Leaders and Indices are quickly back up to higher highs again. The DOW 30, S&P 500 Index, and NASDAQ 100 were able to make higher highs, but not that many individual stocks.
Gold, Silver, & Copper Mining stocks are making highs now, signaling that Inflation has not peaked. So either Metals are wrong, or Stocks are wrong about the FED lowering short term Rates soon. We will Follow the Money.
We Buy the strongest Leaders on pull-backs. If you continue to Follow the Green Line System, your Account should flow into the Strongest areas and your Account value should be able to grow in both Bull and Bear Markets. Follow the MONEY, not the MEDIA.
______________________________________________________________________________
Completed Trades this week:
DB DEUTSCHE BANK Target was Hit for a 6.3% Gain.
HMY HARMONY GOLD Target was Hit for a 6.3% Gain.
HOOD ROBINHOOD MKTS. Target was Hit for a 5.4% Gain.
MU MICRON TECH Target was Hit for an 11.2% Gain.
XLF FINANCIAL FUND Target was Hit for a 3.6% Gain.
______________________________________________________________________________
For the week the Dow was up 1.36%, the S&P 500 was up 1.65% and the NASDAQ 100 was up 2.19%. Many of the major Indices still have a Relative Strength below 80, so you should currently own the stronger Funds here.
The Inflation Index (CRB) was down 0.61% for the week and is Above the Green Line, indicating Economic Expansion.
Bonds were up 1.41% for the week, and are Below the Green Line, indicating Economic Expansion.
The US DOLLAR was down 0.80% for the week and is Above the Green Line.
Crude Oil was up 1.69% for the week at $79.58 and GOLD was up 1.79% at $2217.400.
_______________________________________________________________________
DAY TRADERS: We are doing many micro Day Trades on our Discord Trading Hub (free). Please join Discord & X (Twitter) with your cell phone app for the fastest Trade Alerts and Daily email notifications during the day. Other methods of notification have been too slow. Also, please check our our Live Trading Room on YouTube during Market hours.
More action this week on the Day Trading Scrolling Charts, and Day Trading Charts for Indices & Large Caps.
_______________________________________________________________________
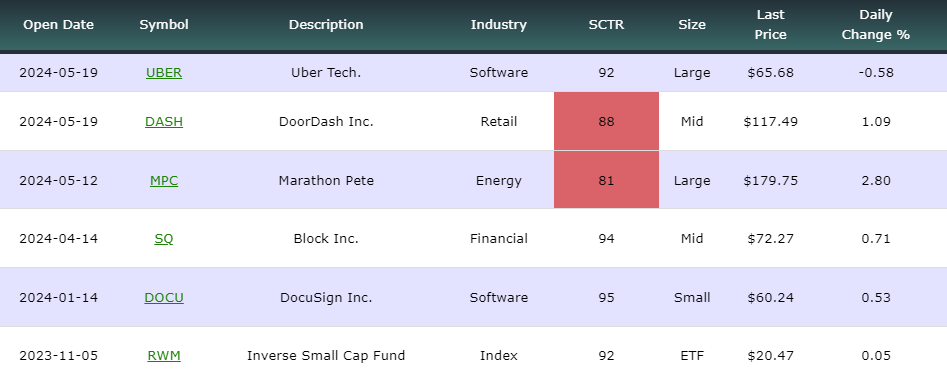
SWING TRADE BUYS SOON:
We are now in 1 Three Star logged Swing Trading Positions for the Short & Medium Term. There are 4 investments on the Short Term Watch List.
Be patient and WAIT for Green Zone Buy Signals!
______________________________________________________________________________
LONG TERM WATCH LIST
ATGL Long Term Weekly Watchlist- Click here for scrolling charts.
CRM SALESFORCE.COM Bought on the Close Friday at $285.61. Target $315 and Stop on Close below $266.55.
HIMS HIMS & HERS HEALTH Weekly Money Wave Buy Signal, but already up 18.55%. AVOID.
______________________________________________________________________________
Important Links| Top 100 | Stage Chart Investing | CNN Fear & Greed Index |
| Dividend Growth Portfolio | ETF Sector Portfolio | Dogs of the Dow |
| Long Term Strategy | Stage Chart Investing | Articles |
Alert! Market Risk is Medium (YELLOW). The probability of successful Short Term Trades is better, when the % of stocks above the 50-day avg. is below 20.
Tell your Friends about the Green Line, and Help Animals.
______________________________________________________________________________
QUESTION: Winter writes ““Don’t take a Loss” confuses me. What does that mean?”
ANSWER: When the Investment has a Money Wave Buy Signal, it should pop up 3-6 % in just a few days.
If it is not popping up well, and the Money Wave > 50, plan to Get out soon , and Don’t Take a Loss! (Get Out Even).
Something must be Wrong. There will be plenty more Money Wave Signals soon… Raise Cash, and don’t get Stuck! Wait for the next one.
Good trading and tell your friends!
ATGL