Above the Green Line -01
  • Market Insights
        • Commentary
          • Daily
          • Weekly
        • BUY / SELL SIGNALS
          • Trade Posts
          • Recent Trade Alerts
          • Recent Day Trades
        • BLOGROLL
          • Dividend Growth Blog
          • ETF Sector Blog
          • Dow Dogs
          • TPOW Blog
  • Strategies
        • SWING TRADING
          • Current Positions
          • Watchlists
          • Closed Positions
          • Candidates - TOP 100
          • Specialty Stocks
        • WEEKLY STOCK PICK
          • TPOW Charts
          • TPOW Performance
          • TPOW Strategy Guide
          • TPOW Performance Dashboard
        • DAY TRADING
          • Watch List
        • ATGL DASHBOARD
        • ETF STRATEGIES
          • ETF Sector Rotation
          • ETF Sector Portfolio
        • DIVIDEND GROWTH
          • Dividend Growth Portfolio
          • Dividend Calendar
        • DOGS OF THE DOW
          • Dogs of the Dow Portfolio
          • DOW 5 Portfolio
  • Markets
        • US MARKET
          • Commodities
          • Energy
          • Precious Metals
          • Volatility
        • GLOBAL MARKETS
          • Market Indices
          • Economic Calendar
          • FOREX Heat Map
          • FOREX Cross Rates
          • Crypto Currency Market
  • Investing
    • Discord Community
    • Dashboard
  • Resources
        • ARTICLES
          • Dividend Growth Model Articles
          • ETF Articles
          • Investment Strategies Articles
          • Market and Economic Insights
          • Stock Trade Articles
          • Stock Reviews
        • TOOLS
          • Stock Scanners
          • Charting Software
          • Brokerage Firms
        • STOCK CHARTS
          • Key Components
          • Reading Charts
          • Drawing Stock Charts
          • Identifying Trends
        • RETIREMENT PLANNING
  • About
    • Contact Us
    • How to Win
    • #1 At Stockcharts
    • Disclaimer
    • FAQ
  • Log In
  • Subscribe

March 7, 2021

Green Line Weekly Mar 7, 2021

TSLA Chart
Tesla Inc. (TSLA) is back down in the Weekly Green Zone for a Buy Signal soon, after a 40% drop.

3/7/2021 Markets were up for the week, but the Big Tech and Momentum stocks pulled back sharply on profit taking and higher Interest Rates. Most major Indices were able to Close back above the Red Lines (50-day avgs.) as Banking and Oil Stocks became much stronger recently. The Indices need to bounce up soon and make New Highs for this rally to continue. The Stimulus Bill should be approved very soon, which could pop the Markets back up to re-test the recent Highs.

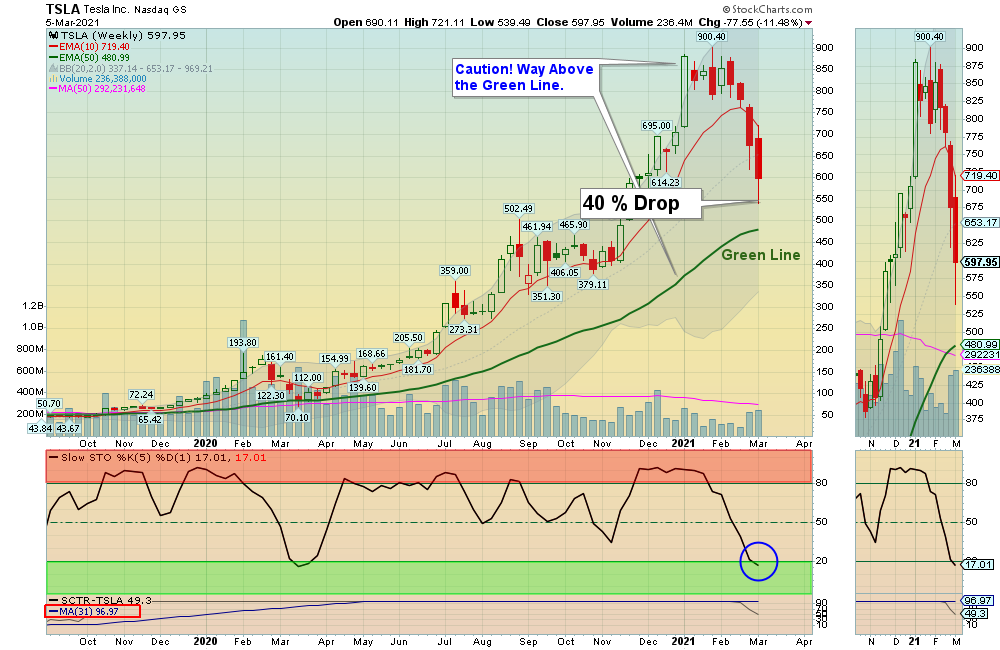
Many Leaders and Momentum Investments are now on Sale 40-60 % off from last month’s Highs. Tammy now has FEAR because she bought Way Above the Green Lines and is getting Flushed out with losses. That’s when we like to Buy. The Swing Trading Watch List has 10 Candidates to Buy soon, and the Long Term list below has many favorites on Sale.

SEE SUPPLEMENTAL CHARTS

For the week the Dow was up 1.87%, the S&P 500 was up 0.81%, and the Nasdaq 100 was down 1.74%. The Long Term Trend for the Indices is up. 

The Inflation Index (CRB) was up 1.58% for the week and is Above the Green Line, indicating Economic Expansion.

Bonds were down 2.83% for the week, and are Below the Green Line, indicating Economic Expansion.

The US DOLLAR was up 1.02% for the week and is returning up to the Green Line.. 

Crude Oil was up 7.46% for the week at $66.09 and GOLD was down 1.75%  at $1698.50.

_____________________________________________________________________________________________

MONEY WAVE BUYS SOON

We are currently in 3 logged Current Positions, for the Short & Medium Term.  There are 10 Investments on the Short Term Watch List. 

Be patient and WAIT for Green Zone Buy Signals!

______________________________________________________________________________________________

LONG TERM INVESTMENTS  (Several Leaders have pulled back near the Green Lines.)

Currently very few Leading Investments that are down near the Weekly Green Zones. Caution.     

BE      BLOOM ENERGY CORP.      Buy if it Closes above the Pink Line on the Daily Chart.

FCEL      FUELCELL ENERGY INC.      Buy if it Closes above the Pink Line on the Daily Chart.

LL       LUMBER LIQUIDATORS       Buy if it Closes above the Pink Line on the Daily Chart.  

NIO      NIO INC.      Buy if it Closes above the Pink Line on the Daily Chart.

PTON      PELOTON INTERACTIVE      Buy if it Closes above the Pink Line on the Daily Chart.

TSLA      TESLA INC.      Buy if it Closes above the Pink Line on the Daily Chart.

XBI      BIOTECH FUND      Weekly Money Wave must Close in the Green Zone.

______________________________________________________________________________________

Click for  Watch Lists
Click for  Current Positions
Click for  Closed Positions

New: My Trading Dashboard

Day Trading Watch List

NEW TOP 100 LIST Mar 1, 2021
Dividend Growth Portfolio  
ETF Sector Rotation System      
Dogs of the DOW System
Long Term Strategy for IRAs & 401k Plans
CNN Fear & Greed Index

Alert! Market Risk is MEDIUM (Yellow Zone). The probability of successful Short Term Trades is better, when the % of stocks above the 50-day avg. is below 20. 

Tell your Friends about the Green Line, and Help Animals.

___________________________________________________________________________________________

4 Ways to Get your Daily Money Wave Alert: (Intra-day Alerts are sent by Twitter only).

  • Emailed to your box between 3:40 3:50pm EST.
  • Website menu Commentary/Buy/Sell Signals
  • Twitter mobile notifications @AboveGreenLine
  • Text messages: Email us your Cell number & phone carrier.


Related Post

– Green Line Weekly Feb 28, 2021

Subscribe to Our Newsletter

AGL Logo

Get our eBook Now!

Candlestick - A Swing Traders Friend

We don’t spam! Read our privacy policy for more info.

You’ve been successfully subscribed to our newsletter!

Voted #1 at Stock Charts

SH Chart
Inverse S&P 500 Fund (SH) will have a Money Wave Buy today.

Help Us Help Animals

Help Us Help Animals

Recent Comments

  • Market Breadth Indicators: A Trader’s Guide to Early Trend Detection on Backtesting: Definition and How a Trading Strategy Backtest Works
  • Island Reversal Pattern: Definition and Formation Explained on Double Top Pattern: How to Identify and Trade This Reversal Signal
  • Channel Pattern Guide: What It Is and Why It Matters on A Guide to Forecasting Using Moving Averages
  • What Is a Broadening Bottom Chart Pattern? Full Guide on Bull vs. Bear Market: An Investor’s Guide to Market Phases
  • ATGL Weekly Money Flow - 2025-05-11 on ATGL Top Pick of the Week! Apr 6, 2025

Become a Green Liner!

Help me make more Money in the Stock Market.

ON ATGL

  • DashBoard
  • Weekly Commentary
  • Daily Buy / Sell Signals
  • Day Trade Setup
  • Trading Rooms

Design & Develop By Pixelvect

STRATEGIES

  • Swing Trading
  • ATGL Pick of the Week
  • Dividend Growth
  • ETF Sector Rotation
  • Dogs of the Dow

HELP

  • ATGL Trading Rules
  • FAQ
  • Account Maintenance
  • Contact US
  • Join

FOLLOW US

Instagram Linkedin Twitter Facebook

© COPYRIGHT 2024 · ABOVETHEGREENLINE.COM · ALL RIGHTS RESERVED · PRIVACY · TERMS · CONTACT · WATCHLIST · CURRENT