
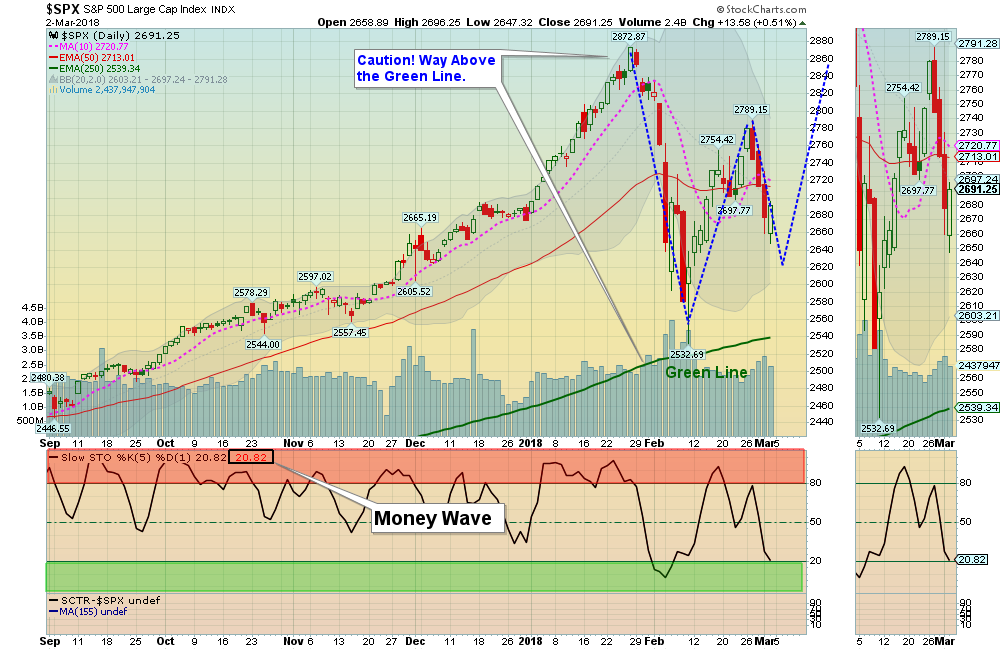
03/04/2018: Markets were down about 2% for the week, as they rolled over to re-test the February lows . It would be Bullish if this down move drops less than in Feb. Then the Markets could re-test the January Highs.
The Markets are having a needed pullback to created more Money Wave Buys soon.
The very Strongest Leaders and the NASDAQ 100 Index are hardly coming down, which means very few Sellers. The Long Term Trend is UP.
Bonds were over-sold and are having a “dead cat” bounce up near the Red Line (50-day avg.) But Bonds have Low Relative Strength, and are Below the Green Line (which means more Sellers than Buyers).
The Inflation Index (CRB) is trying to get back above the 196.36 Break Out level, which shows some weakness with Inflation. The US DOLLAR bounced off the Lows, and made it up to the Red Line.
Crude Oil was down 3.6% for the week at $61.25, and GOLD was down 0.5%.
___________________________________________________________________________________________
MONEY WAVE BUYS SOON: We are currently in 2 logged Open Positions, for the Short & Medium Term. There are 8 Investments on the Short Term Watch List. Be patient and WAIT for Green Zone Buys!
______________________________________________________________________________________________
LONG TERM TRADES
The Funds below are currently out of favor and and some are having trouble with nice uptrends. But historically these could possibly Double or more from these lower levels. We are looking for a good Entry Point for these, but need the entire Economy & Inflation to pick up speed:
DBC COMMODITY FUND Relative Strength is back Below 90.
FCX FREEPORT MCMORAN Wait for the next weekly Green Zone Buy.
JJC COPPER FUND Relative Strength is back Below 90.
KOL COAL FUND Wait for the next Green Zone Buy on the Daily Chart.
REMX RARE EARTH FUND Volume is too low. Wait to Buy near the Red Line.
TWTR TWITTER INC. Broke Out Above $25.85. Wait to Buy near the Red Line.
UGA US GASOLINE FUND Volume is too low… Break Out Above $33.07 did not hold.
VALE VALE DE RIO Wait for the next Green Zone Buy on the Daily Chart.
___________________________________________________________________________________________
Click for Portfolio (Open Positions)
Click for Watch List
Click for Closed Positions
Alert! Market Risk is MEDIUM (Yellow Zone). The probability of successful Short Term Trades is higher, when the S&P 500 is down near the Green Line. The Strongest Investments should re-test their Highs from these Over-Sold levels.
Tell your Friends about the Green Line, and Help Animals.
4 Ways to Get your Daily Money Wave Alert:
- Emailed to your box between 3:30- 3:50 pm EST.
- Website menu Commentary/Buy/Sell Signals
- Twitter notifications @AboveGreenLine
- Text messages: Email us your Cell number & phone carrier.


