
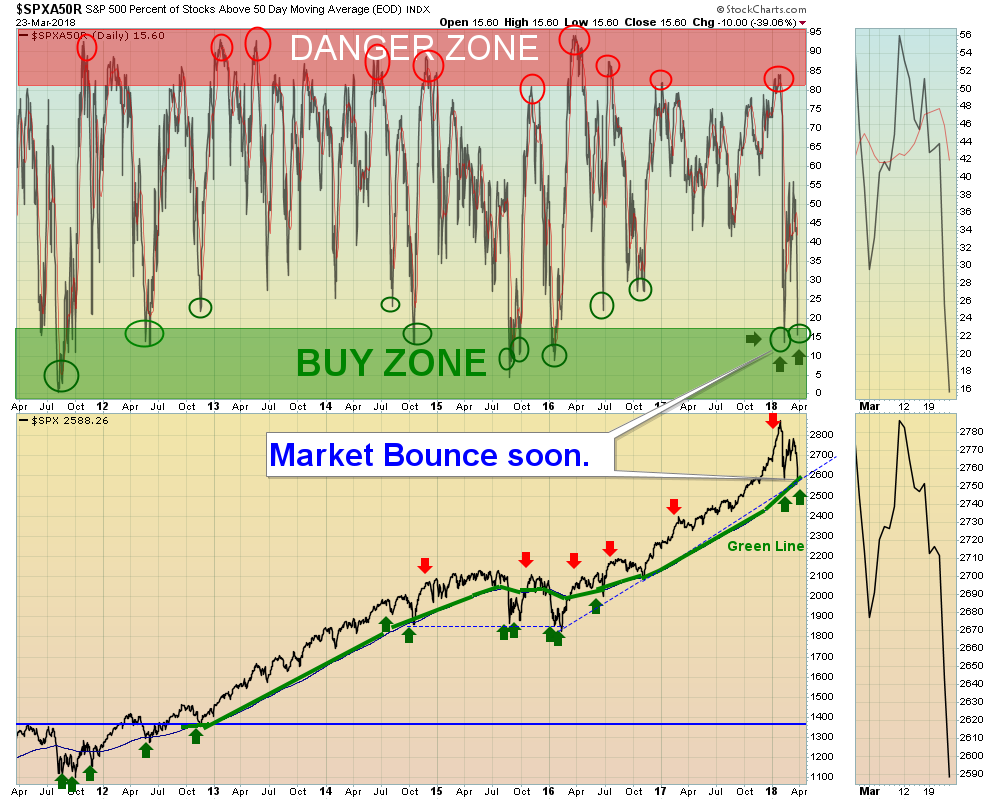
03/25/2018: Markets were down 5-6% for the week, as the Indices dumped down near the February Lows. If the Markets can hold soon, we could see a “W” Pattern for the Indices to Bounce off the Green Lines and possibly re-test the Jan Highs.
The NASDAQ 100 Index and Techs plunged below their Red Lines (50-day avgs.), so the first bounces will probably not be that good (resistance near the Red Lines). Try to Buy Investments that are still Above the Red Lines. The Long Term Trend is UP.
The Chart above shows that only 15.6% on the Stocks in the S&P 500 are currently Above their Red Lines (50-day avgs.) Historically when this happens, Strong Buying comes in, and the Shorts Cover.
The Strongest Leaders are Holding Above their Red Lines. The list of Large Caps that should bounce the best: MU INTC HPE NFLX M AMZN TWTR STX ADBE PGR ADSK TPR NTAP EL RHT EW & AKAM. Most are so strong that they have not even returned to their Green Zones for Buy Signals.
Bonds are bearish (Below the Green Line and Low Relative Strength) but have rallied up to the Red Line (50-day avg.)
The Inflation Index (CRB) is struggling to get back above the 196.36 Break Out level, which shows some weakness with Inflation. The US DOLLAR failed again the Red Line, and is re-testing the recent Lows.
Crude Oil was up 5.66% for the week at $65.88, and GOLD was up 2.90%.
___________________________________________________________________________________________
MONEY WAVE BUYS SOON: We are currently in 4 logged Open Positions, for the Short & Medium Term. There are 10 Investments on the Short Term Watch List. Be patient and WAIT for Green Zone Buys!
______________________________________________________________________________________________
LONG TERM TRADES
The Funds below are currently out of favor and and recent news has cause more weakness. Some are having trouble with nice uptrends. But historically these could possibly Double or more from these lower levels. We are looking for a good Entry Point for these, but need the entire Economy & Inflation to pick up speed:
DBC COMMODITY FUND Relative Strength is back Below 90.
KOL COAL FUND Relative Strength is back Below 90.
REMX RARE EARTH FUND Volume is too low. Wait to Buy near the Red Line.
RH RESTORATION HARDWARE Buy near the Green Line with a Sell Top Below.
TWTR TWITTER INC. Broke Out Above $25.85. Buy soon on bounce at the Red Line.
___________________________________________________________________________________________
Click for Portfolio (Open Positions)
Click for Watch List
Click for Closed Positions
Alert! Market Risk is LOW (Green Zone). The probability of successful Short Term Trades is higher, when the S&P 500 is down near the Green Line. The Strongest Investments could re-test their Highs from these Over-Sold levels.
Tell your Friends about the Green Line, and Help Animals.


