
03/15/2020: Markets were down big for the week as the Indices sliced down Way Below the Green Lines on FEAR. The DOW 30 Index was 5500 points Below the Green Line on Thursday. Since history tells us that Investments always return near their Green Lines, we Lowered the Sell Stop Losses on all positions to avoid large losses from FEAR Selling.
Eventually the FEAR will subside, as human emotions are temporary (who remembers the 12,000 US deaths from from H1N1 virus in 2009?)
The ideal Investment Portfolio today would be to only own the Leaders that are still Above the Green Lines. Many of the Open Positions are holding up well, and could re-test the January Highs. The Plan is to unload weaker position that are currently Below the Green Lines on the next rally.
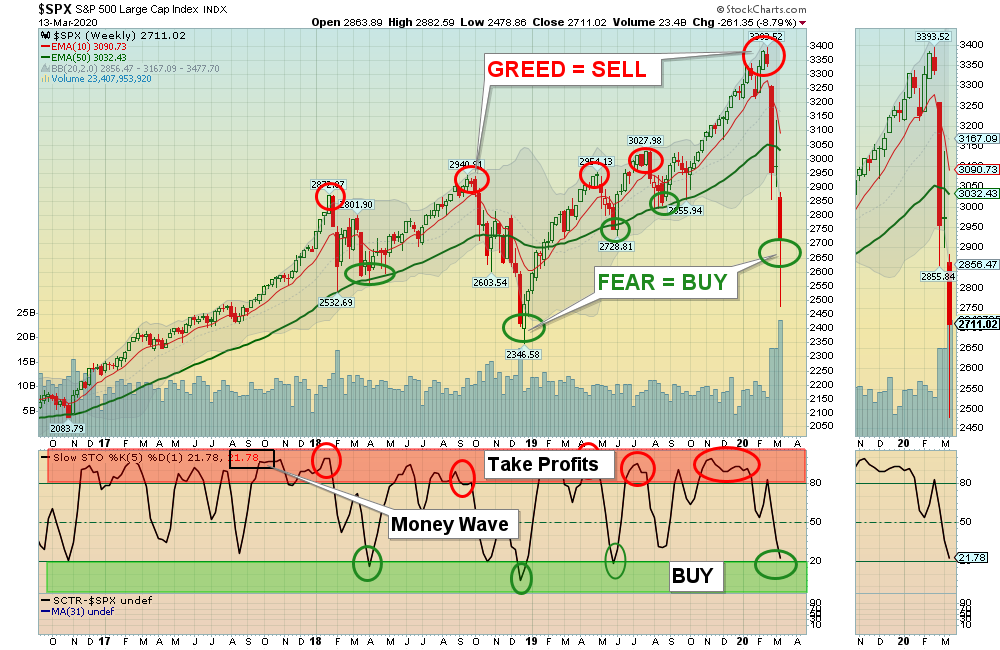
The Markets were Way Above the Green Lines (GREED) in January (take profits), but now the Leaders could be bottoming soon with the 9% Bounce on Friday. The CNN Fear & Greed Index is down from 95 (Greed) in Jan. to 2 on Tuesday (Fear). Emotions allow wise Investors who Buy on FEAR and Sell on GREED to make money.
If you are worried about a Bear Market, there are 2 Inverse Funds that now meet the Green Line Rules (RWM Inverse Small Cap Fund, and VXX Volatility Fund). Both are currently in the Red Zones (probably too late to Buy for the Short Term). Maybe a trade later this week.
For the week the Dow was down 10.33%, the S&P 500 was down 9.46%, and the Nasdaq 100 was down 7.54%. The Long Term Trend for most Indices is still UP.
The Inflation Index (CRB) was down 9.63% and is Below the Green Line, indicating Economic Weakness.
Bonds were down 7.69% for the week and are Above the Green Line, indicating Economic Weakness.
The US DOLLAR was up 5.46% for the week, a New High.
Crude Oil was down 23.13% for the week at $31.73 and GOLD was down 9.31% at $1516.70.
_____________________________________________________________________________________________
MONEY WAVE BUYS SOON:
We are currently in 14 logged Open Positions, for the Short & Medium Term. There are 7 Investments on the Short Term Watch List.
Be patient and WAIT for Green Zone Buy Signals!
______________________________________________________________________________________________
LONG TERM INVESTMENTS (concentrating more on the Short Term now)
Buy the Leading Investments that are down near the weekly Green Zones.
ADBE ADOBE SYSTEMS INC. Wait for next Daily Money Wave Buy.
AMD ADVANCED MICRO Wait for next Daily Money Wave Buy.
CPRT COPART INC. Buy if it Closes above $82.06 on High Volume.
PLUG PLUG POWER INC. Wait for next Daily Money Wave Buy.
______________________________________________________________________________________
Click for Portfolio (Open Positions)
Click for Watch List
Click for Closed Positions
New ETF Sector Rotation System
Long Term Strategy for IRAs & 401k Plans:
Alert! Market Risk is LOW (Green Zone). The probability of successful Short Term Trades is better, when the % of stocks above the 50-day avg. is below 20.
Tell your Friends about the Green Line, and Help Animals
___________________________________________________________________________________________
QUESTION: Peter W. writes “When you say the RSI should be “ABOVE 90 RS “. I look at your chart and it shows SCTR 90, not RSI. Please clarify.
ANSWER: Hi Peter. We don’t use RSI, which is a technical oscillator. We use Relative Strength compared to the Market:
Q: Where do I find the Relative Strength Factor in StockCharts.com so I can add it to my charts?
A: Relative Strength Values comes from the SCTR Rank (StockCharts Technical Rank), www.etfscreen.com for ETFs , and Investor’s Business Daily (IBD) for stocks. We prefer the longer term weighting used by www.etfscreen.com and IBD. We sometimes use a 155-day avg. of StockCharts SCTR, which is at the bottom left of many charts (just below the SCTR Rank) to simulate R S closer to the longer term ranking of IBD ranking.
Good trading, and tell your friends!
AGL