
Watch List and Charts to Buy Soon.
| Daily Swing Watch List to Buy | Daily Swing Charts to Buy |
| Current Daily Swing Positions | Current Swing Charts |
| Closed Daily Swing Results | Trading Dashboard |
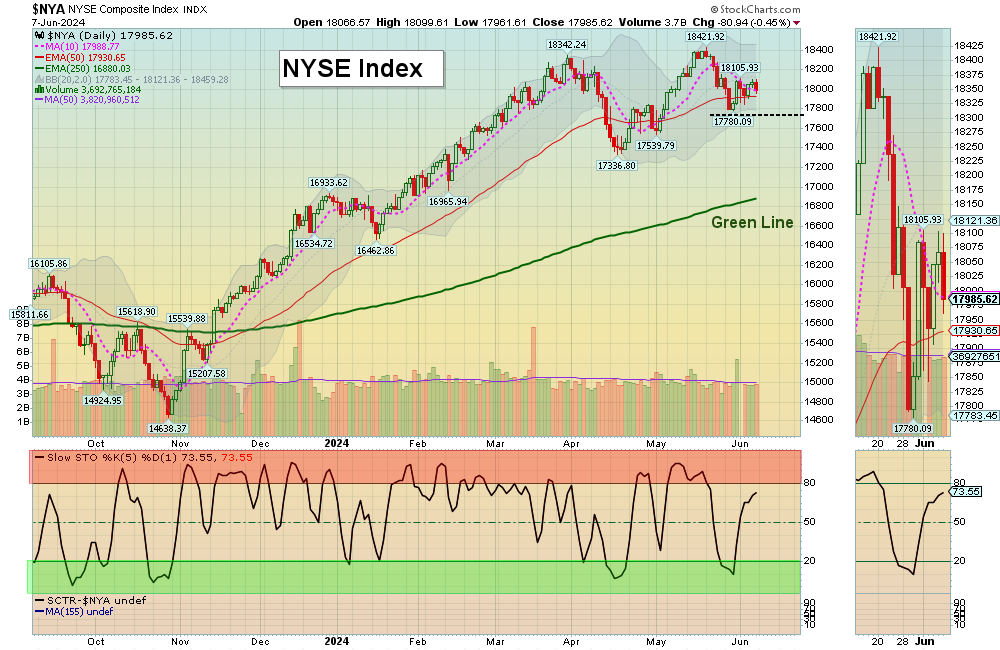
6/9/2024 Markets were mostly higher for the week as many are betting the the FED will begin Printing sooner (lowering of short term Interest Rates). Weak Economic numbers came out, causing Commodity Prices to fall and Bonds rallied.
Most of the Stock Market rally recently has been the Big 7 Stocks, and MSFT AAPL & NVDA are each valued at $3 Trillion. Historically when the internal breadth of the Markets narrow to a small group of stocks like now, profit taking will come in.
If you continue to Follow the Green Line System, your Money should flow into the Strongest areas and your Account value should be able to grow in both Bull and Bear Markets. Follow the MONEY, not the MEDIA.
______________________________________________________________________________
Let’s Go Banana Hunting! (New Trading System)
Learn the Banana Hunt
Our monkey George loves bananas! You can learn to successfully hunt for bananas like George does.
Just watch this quick video and follow the Rules:
Investments move way above or below the Banana Line (yellow line = 200 sma average) from temporary Human Fear or Greed. This Emotion creates Opportunity for Profits.
But first George the monkey waits for a Buy or Sell Signal (W or M pattern) before beginning the Banana Hunt. George is not Emotional like humans, and is well trained.
______________________________________________________________________________
For the week the Dow was up 0.25%, the S&P 500 was up 1.26% and the NASDAQ 100 was up 2.72%. Many of the major Indices still have a Relative Strength below 80, so you should currently own the stronger Funds here.
The Inflation Index (CRB) was down 0.88% for the week and is Below the Green Line, indicating Economic Contraction.
Bonds were up 1.51% for the week, and are Below the Green Line, indicating Economic Expansion.
The US DOLLAR was up 0.22% for the week and is Above the Green Line.
Crude Oil was down 1.90% for the week at $75.51 and GOLD was down 0.48% at $2345.80.
_______________________________________________________________________
DAY TRADERS: We are doing many profitable Day Trades on our Discord Trading Hub (free). Please join Discord or X (Twitter) with your cell phone app for the fastest Trade Alerts and Daily email notifications during the day. Other methods of notification have been too slow. Also, please check our our Live Trading Room on YouTube during Market hours.
_______________________________________________________________________
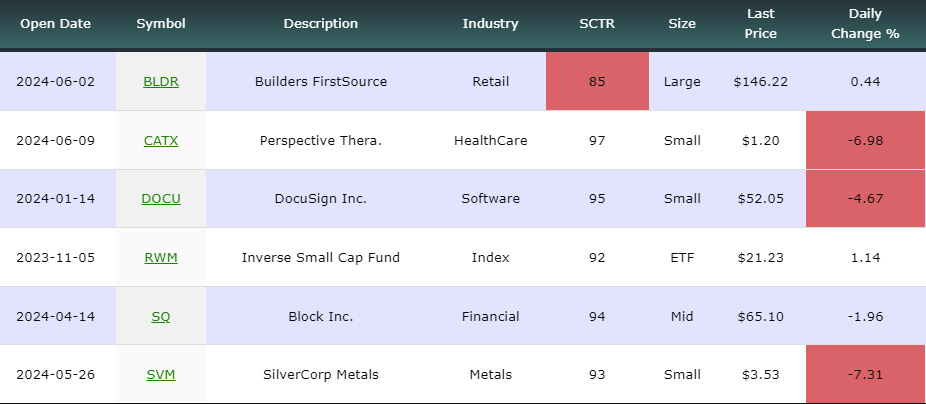
SWING TRADE BUYS SOON:
We are now in 6 Three Star logged Swing Trading Positions for the Short & Medium Term (Volume has been consistently low this year). There are 4 investments on the Short Term Watch List.
Be patient and WAIT for Green Zone Buy Signals!
______________________________________________________________________________
LONG TERM WATCH LIST
ATGL Long Term Weekly Watchlist- Click here for scrolling charts.
TRADES THIS WEEK:
DASH DOORDASH INC. Bought on the Close Friday. Target is $135, EXIT if it is going to Close below $104.04.
UBER UBER TECH Bought on the Close Thursday at $68.91. Target is $81.50, EXIT if it is going to Close below $62.85.
______________________________________________________________________________
Important Links| Top 100 | Stage Chart Investing | CNN Fear & Greed Index |
| Dividend Growth Portfolio | ETF Sector Portfolio | Dogs of the Dow |
| Long Term Strategy | Stage Chart Investing | Articles |
Alert! Market Risk is Medium (YELLOW). The probability of successful Short Term Trades is better, when the % of stocks above the 50-day avg. is below 20.
Tell your Friends about the Green Line, and Help Animals.
______________________________________________________________________________
QUESTION: Steve writes ” What is the deciding factor for you to say “Caution! Way above the Green Line? Thank you.”
ANSWER: Hi Steve, Way Above the Green Line means that if you Buy there, you will probably have a “Sick Feeling” when the Investment returns to the Green Line.
Good trading, and tell your friends!


