
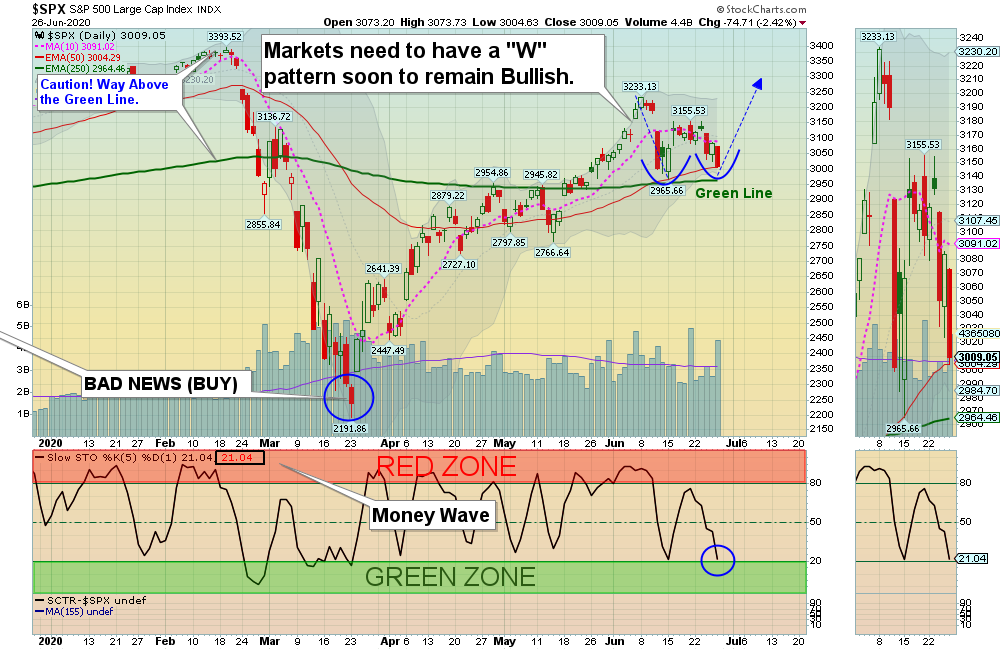
06/28/2020 Markets were down for the week after the Indices could not get above the early June Highs. Virus fears caused the S&P 500 Index to go back down to the Red Line (50-day avg.) Now it must do a “W” pattern bounce up soon for this rally up to continue. The CNN Fear & Greed Index is back down to 45.
The “Stay at Home” stocks like ZOOM, Gaming, BioTechs, and Big FAAMNG and not even coming down enough for Green Zone Buys yet. The Strongest Leaders are returning to the Green Zones for Money Wave Buy Signals soon.
Please WAIT for Watch List to grow with more Leaders which should have Money Wave Buy Signals soon.
For the week the Dow was down 3.25%, the S&P 500 was down 2.78%, and the Nasdaq 100 was down 1.47%. The Long Term Trend for the Indices is up.
The Inflation Index (CRB) was down 2.58% and is Below the Green Line, indicating Economic Weakness.
Bonds were up 1.76% for the week and are Above the Green Line, indicating Economic Weakness.
The US DOLLAR was down 0.11 % for the week and Closed Below the Green Line.
Crude Oil was down 3.36% for the week at $38.49 and GOLD was up 1.56% at $1780.30, a New High.
_____________________________________________________________________________________________
MONEY WAVE BUYS SOON:
We are currently in 1 logged Current Positions, for the Short & Medium Term. There are 6 Investments on the Short Term Watch List.
Be patient and WAIT for Green Zone Buy Signals!
______________________________________________________________________________________________
LONG TERM INVESTMENTS (Most of the Leaders are back up in the Weekly Red Zones.)
LLNW LIMELIGHT NETWORKS INC. Gapped Up on news and Closed up 43% for the week (So we missed it).
Buy the Leading Investments that are down near the Weekly Green Zones.
AUY YAMANA GOLD Buy if it Closes above $5.65 on High Volume. All time High is $18.50.
IOVA IOVANCE BIO. Wait for the next Daily Money Wave Buy.
NG NOVA GOLD RESOURCES Buy if it Closes above $9.28 on High Volume. All time High s $16.00.
RRC RANGE RESOURCES CORP. Buy if it Closes above $7.14 on High Volume. All time High is $92.45.
______________________________________________________________________________________
Click for Current Positions
Click for Watch List
Click for Closed Positions
NEW DAY TRADE LIST JUN 27, 2020
Dividend Growth Portfolio (we are now posting a Dividend Calendar for the entire portfolio to assist with planning purposes).
ETF Sector Rotation System – Next Quarterly Rotation will be on June 30, 2020.
Long Term Strategy for IRAs & 401k Plans
Alert! Market Risk is MEDIUM (Yellow Zone). The probability of successful Short Term Trades is better, when the % of stocks above the 50-day avg. is below 20.
Tell your Friends about the Green Line, and Help Animals
___________________________________________________________________________________________
QUESTION: Randal W writes “Hi, I’m new to the site, though have followed from the sidelines since the crash of 2008. Thank you for your continued effort…consistency combined with responsibility are virtues I aspire to.
I would expect the SCTR (StockCharts Technical Rank) to point the way toward stocks that would have the power to move outside the influence of SPY, for example…the one I follow. Is SCTR simply used to identify potential trades? Thanks again for all the hard work”.
ANSWER:
Hi Randall, and thank you. Most Investments that move with the S&P 500 and the Economy will not diverge much from the Major Indices. However, Inverse Funds and Inflationary Investments can do the OPPOSITE of the Major Indices, like in the 2008 Bear. But this 11 year Bull is not over officially over yet. You will have to WAIT. But the weaker World Market might be building the dreaded “Right Shoulder” now.
You can measure how Investments perform relative to the S&P 500 Index with a Relative Strength Indicator (or SCTR from StockCharts).
Relative Strength Values comes from the SCTR Rank (StockCharts Technical Rank), www.etfscreen.com for ETFs , and Investor’s Business Daily (IBD) for stocks. We prefer the longer term weighting used by www.etfscreen.com and IBD. We sometimes use a 155-day avg. of StockCharts SCTR, which is at the bottom left of many charts (just below the SCTR Rank) to simulate R S closer to the longer term ranking of IBD ranking.
Why not own the Strongest Investments only, on pull-backs?
Good trading and tell your friends!
AGL