
6/27/2021 Markets were up sharply for the week as the S&P 500 Index bounced up perfectly off the Red Line (50-day avg. ) and was able to make a Higher High. Money is not leaving the Markets, as the FED has promised us that Inflation is not a problem. T-Bonds prices are normally a good measure of Inflation, but the FED also said that they will continue Buying $120 BILLION of Debt monthly. So with Bonds being manipulated, only Commodities tell us that is a Inflation problem, and Commodities are currently over-bought (Way Above the Green Lines).
So the S&P 500 & NASDAQ 100 Indices have become stronger, while the DOW 30 and Small Caps Indices are now weaker. Markets have basically been at Equilibrium for several weeks (same amount of Buyers and Sellers). Smart Money is not Buying (as evidenced by the Low Volume), but Mutual Funds continued to receive Money from the FOMO crowd (Fear Of Missing Out), so they keep Buying.
This lack of Selling has made it harder for us to make much Money with the Green Line System lately, but that will change. The FOMO crowd will eventually run out of Money.
Changes will be made on Wednesday June 30th for the ETF Sector Rotation System.
For the week the Dow was up 3.45%, the S&P 500 was up 2.82%, and the Nasdaq 100 was up 2.11. The Long Term Trend for the Indices is up.
The Inflation Index (CRB) was up 2.21% for the week and is Above the Green Line, indicating Economic Expansion.
Bonds were down 2.56 % for the week, and are Below the Green Line, indicating Economic Expansion.
The US DOLLAR was down up 0.40% for the week.
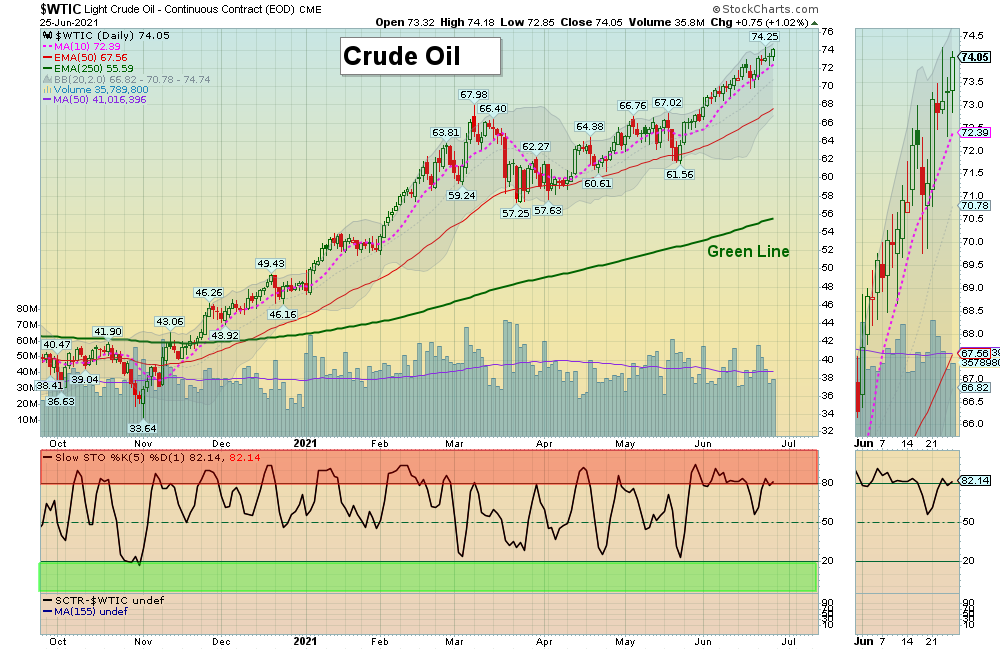
Crude Oil was up 3.87% for the week at $74.05 (a New High) and GOLD was up 0.50% at $1777.80.
_____________________________________________________________________________________________
MONEY WAVE BUYS SOON
We are currently in only 3 logged Current Positions, for the Short & Medium Term. There are 5 investments on the Short Term Watch List.
Be patient and WAIT for Green Zone Buy Signals!
______________________________________________________________________________________________
LONG TERM INVESTMENTS (Many Leaders have pulled back , but Markets are near Highs.)
ETSY ETSY INC. Closed above $175.14 but the Volume was not High. Avoid.
PLG PLATINUM GROUP Bought above the Pink Line (10-day avg.). Target is $5.25. Exit if it is going to Close below the Green Line.
RIOT RIOT BLOCKCHAIN Buy on the next Daily Money Wave Buy Signal with High Volume.
TRIP TRIPADVISOR INC. Buy if it Closes above the Red Line (50-day avg.) with High Volume.
TSLA TESLA INC. Bought above $635.59. Target 1s $725. Exit if it is going to Close below the Red Line.
ZKIN ZK INT’L. GROUP Buy if it Closes above the Red Line (50-day avg.) with High Volume.
______________________________________________________________________________________
Click for Watch Lists
Click for Current Positions
Click for Closed Positions
Day Trading Scrolling Charts
UPDATED Top 100 List Jun 2, 2021
Dividend Growth Portfolio
ETF Sector Rotation System
Dogs of the DOW System
Long Term Strategy for IRAs & 401k Plans
CNN Fear & Greed Index
Scrolling Stage Chart Investing Charts
Alert! Market Risk is MEDIUM (Yellow Zone). The probability of successful Short Term Trades is better, when the % of stocks above the 50-day avg. is below 20.
Tell your Friends about the Green Line, and Help Animals.
___________________________________________________________________________________________
QUESTION: David A writes: “I don’t get the Alerts during the day. What gives?”
ANSWER: Hi David. The Daily Emails should arrive in your Mailbox before 3:50 pm EST. The Intra-day Alerts are only going out by Twitter at this time, as the other methods are too slow. Please follow us on Twitter and set up your account for Mobile Notifications. @AboveGreenLine
We can help you set up a free Twitter account for mobile notifications, if you want?
4 Ways to Get your Daily Money Wave Alert:
• Emailed to your box between 3:40 3:50pm EST.
• Website menu Commentary/Buy/Sell Signals
• Twitter notifications @AboveGreenLine
• Text messages: Email us your Cell number & phone carrier.
Thank you,
ATGL


