
6/20/2021 Markets were lower for the week as the Stock Indices were Way Above the Green Lines and could not exceed the previous May Highs. So profit taking came in, and the FED has finally accepted that Inflation is now a possibility. Many are now expecting the FED to cut back soon on their massive Printing, as the US Dollars and T-Bonds rallied back up near the Green Lines this week. And Metals were lower with Gold dropping 5.88% this week.
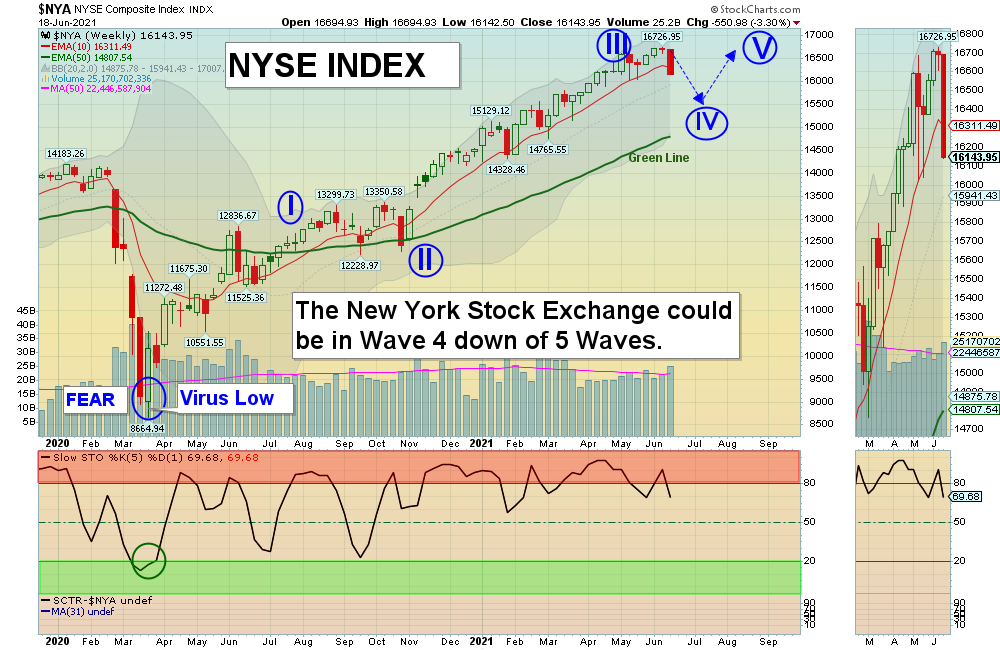
Markets are probably now in a Corrective Wave 4 down now (see Chart above), and then should try the Highs again in a few weeks (Wave 5 up). The Dollar and Bonds should Fail soon near the Green Line and go back down. That could cause a pull back on the Big Tech and the NASDAQ 100 Fund that were up this week on the strong Dollar.
Hopefully you are seeing the rotation and Flow of Money into new areas where the Herd is not. Money is now flowing into the Commodity Fund (DBC), Energy Fund (XLE), Financial Fund (XLE), Retail Fund (XRT), & Oil Services Fund (XOP). Will your Investments be OK when Interest Rates and Inflation pick up? If you follow the Green Line System, historically you will be in Investments where Smart Money is moving to.
For the week the Dow was down 3.38%, the S&P 500 was down 1.89%, and the Nasdaq 100 was up 0.41% (New High). The Long Term Trend for the Indices is up.
The Inflation Index (CRB) was down 3.01% for the week and is Above the Green Line, indicating Economic Expansion.
Bonds were up 2.40 % for the week, but are Below the Green Line, indicating Economic Expansion.
The US DOLLAR was way up 1.83% for the week and tagged the Green Line.
Crude Oil was up 0.54% for the week at $71.29 (a New High) and GOLD was down 5.88% at $1769.00.
_____________________________________________________________________________________________
MONEY WAVE BUYS SOON
We are currently in only 2 logged Current Positions, for the Short & Medium Term. There are 9 Investments on the Short Term Watch List.
Be patient and WAIT for Green Zone Buy Signals!
______________________________________________________________________________________________
LONG TERM INVESTMENTS (Many Leaders have pulled back, but Markets are near Highs.)
DBC COMMODITY FUND Buy on the next Daily Money Wave Buy Signal with High Volume. SOON.
ETSY ETSY INC. Buy if it Closes above $175.14 with High Volume.
PLG PLATINUM GROUP Buy if it Closes above the Pink Line (10-day avg.) with High Volume.
RIOT RIOT BLOCKCHAIN Buy on the next Daily Money Wave Buy Signal with High Volume.
TRIP TRIPADVISOR INC. Buy if it Closes above the Red Line (50-day avg.) with High Volume.
TSLA TESLA INC. Buy if it Closes above the Red Line (50-day avg.) with High Volume.
ZKIN ZK INT’L. GROUP Buy if it Closes above the Red Line (50-day avg.) with High Volume.
______________________________________________________________________________________
Click for Watch Lists
Click for Current Positions
Click for Closed Positions
Day Trading Scrolling Charts
UPDATED Top 100 List Jun 2, 2021
Dividend Growth Portfolio
ETF Sector Rotation System
Dogs of the DOW System
Long Term Strategy for IRAs & 401k Plans
CNN Fear & Greed Index
Scrolling Stage Chart Investing Charts
Alert! Market Risk is MEDIUM (Yellow Zone). The probability of successful Short Term Trades is better, when the % of stocks above the 50-day avg. is below 20.
Tell your Friends about the Green Line, and Help Animals.
___________________________________________________________________________________________
QUESTION: Winter writes ““Don’t take a Loss” confuses me. What does that mean?”
ANSWER: When the Investment has a Money Wave Buy Signal, it should pop up 3-6 % in just a few days.
If it is not popping up well, and the Money Wave > 50, either Get the H out, or Don’t Take a Loss!
Something must be Wrong. There will be plenty more… Raise Cash, and don’t get Stuck! Wait for the next Signal. There will be more.
Good trading and tell your friends!
ATGL