Above The Green Line

  • Commentary
    • BUY / SELL SIGNALS
      • Stock Alerts
    • DIVGRO BLOG
    • ETF SECTOR BLOG
    • DOW DOGS BLOG
    • NEWS
    • STOCK IDEAS
  • Strategies
    • SWING TRADING
      • CURRENT POSITIONS
      • WATCHLISTS
      • CLOSED POSITIONS
      • CANDIDATES – TOP 100
      • SPECIALTY STOCKS
    • DAY TRADING
      • Watch List
    • DIVIDEND GROWTH
      • Dividend Growth Portfolio
      • Dividend Calendar
    • DOGS OF THE DOW
      • Dogs of the Dow Portfolio
      • DOW 5 Portfolio
    • ETF SECTOR ROTATION
      • ETF Sector Portfolio
  • Markets
    • US MARKET
      • Commodities
      • Energy
      • Precious Metals
      • Volatility
    • GLOBAL MARKETS
      • MARKET INDICES
      • ECONOMIC CALENDAR
      • FOREX HEAT MAP
      • FOREX CROSS RATES
      • CRYPTOCURRENCY MARKET
    • DASHBOARD
    • IDEAS
  • Investing
    • FORUM
  • Resources
    • ARTICLES
    • WEEKLY STOCK
    • RETIREMENT PLANNING
    • BLOGROLL
    • FAQ
  • About
    • CONTACT US
    • HOW TO WIN
    • #1 AT STOCKCHARTS
  • Log In
  • Subscribe

July 8, 2018

Green Line Weekly Jul 8, 2018

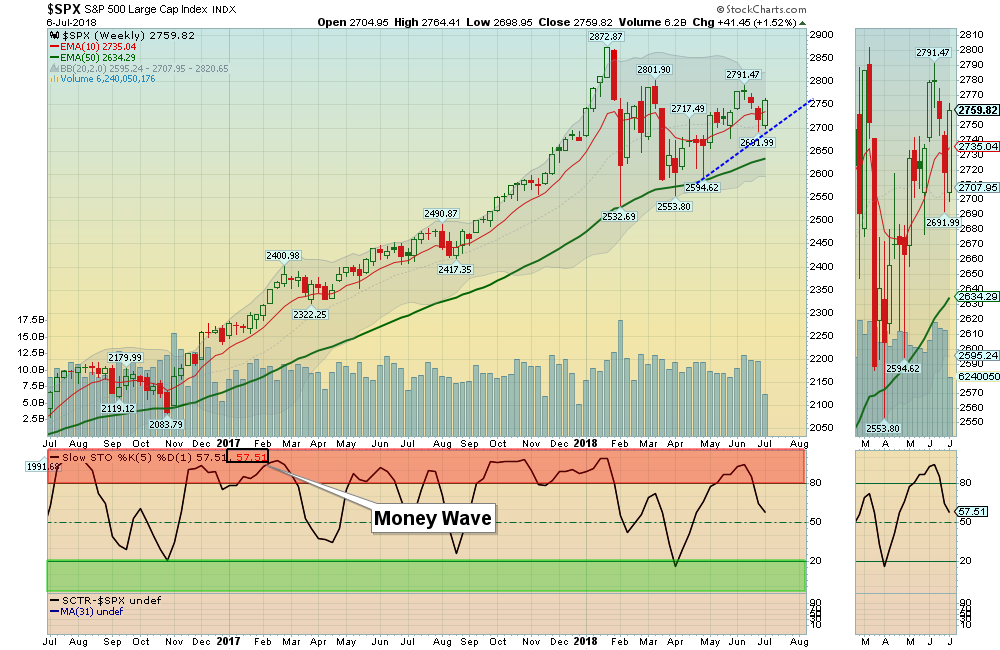
SPX Chart
The S&P 500 needs to make New Highs for the rally to continue.


07/08/2018:  Markets were up for the week, but the Large Cap DOW & S&P 500 Indices are not bouncing very well. Stock now have competition from higher Interest Rates and Commodity prices.

The Small Cap Index was able to get back up to the Highs recently.  For the week, the Dow rose 0.8%, 2.4% for the Nasdaq and 1.5% for the S&P 500.  The Long Term Trend on the Stock Markets is UP.


The Inflation Index (CRB) was down 1.19% but is in a mild Up-Trend.

Bonds  were up again for the week and Closed Above the Green Line, which is forecasting Economic weakness.

The US DOLLAR  is pulling back down towards the Red Line (50-day avg.)

Crude Oil was down 0.47% for the week at $73.85 after making New Highs at $75.27, and GOLD was up  0.10%.

___________________________________________________________________________________________

MONEY WAVE BUYS SOON:   

We are currently in 13 logged Open Positions, for the Short & Medium Term.  Most are now in the Yellow or Red Zones, so please have Sell Stops below them. There are 3 Investments on the Short Term Watch List. 

Be patient and WAIT for Green Zone Buys!

______________________________________________________________________________________________

LONG TERM TRADES 

The Funds below are correcting down to their Green Lines, but the Relative Strength is remaining high. These tend to Bounce nicely when the weekly Money Wave crosses up > 20.


FCAU     FIAT CHRYSLER    Wait for weekly Close Above the Red Line of $20.66 (50-day avg.)

IBKR    INTERACTIVE BROKERS    Wait for Weekly Money Wave Close > 20.

INTC    INTEL CORP.     Wait for Weekly Money Wave Close > 20.

IOVA    IOVANCE BIOTHERA.      Wait for Daily Close Above $14.10.

SCCO    SOUTHERN COPPER    Wait for weekly Close Above the Red Line of $48.93 (50-day avg.)

SPLK    SPLUNK INC.     Wait for Weekly Money Wave Close > 20.

VALE    VALE DO RIO    Wait for weekly Close Above the Red Line of $48.93 (50-day avg.)

VLO    VALERO ENERGY    Wait for Weekly Money Wave Close > 20.


___________________________________________________________________________________________

Click for  Portfolio (Open Positions)  
Click for  Watch List
Click for  Closed Positions


Alert! Market Risk is Medium (Yellow Zone). The probability of successful Short Term Trades is higher, when the S&P 500 is down near the Green Line. 


Tell your Friends about the Green Line, and Help Animals.


QUESTION:  Ray writes “How do I find a Chart on the Portfolio of stocks?

Thanks, Ray.”

ANSWER: Please click on the Portfolio Link of each email.

The click on the Green Symbol  of the Investment (ex. URBN for Daily Chart) , and Green Round Circle (for the 60-min Chart).

Good trading, and tell your friends!

Posted By AbovetheGreenLine at 1:40 pm 2 Comments

Comments

  1. pat@mapleprinting.com says

    July 11, 2018 at 1:06 pm

    Hi

    Just a quick Question 20. ( What do u mean by Money Wave ? are u referring to RSI Value ?)

    2. Put Stop Loss under Green Line ?? or Pink Line ??
    Are u trying to find a value !

    Regards
    Pat

    Log in to Reply
    • AbovetheGreenLine says

      July 11, 2018 at 1:12 pm

      Hi Pat. The Money Wave is the same as the Slow Stochastic near the bottom of the Charts… Closing > 20 creates a Short Term Buy Signal.

      Try to Buy coming out of the Green Zones, and take profits in the Red Zones..

      Q: Where do I find the Relative Strength Factor in StockCharts.com so I can add it to my charts?
      A: Relative Strength Values comes from the SCTR Rank (StockCharts Technical Rank), http://www.etfscreen.com for ETFs , and Investor’s Business Daily (IBD) for stocks. We prefer the longer term weighting used by http://www.etfscreen.com and IBD.

      Green Line Rules

      Log in to Reply

Leave a Reply Cancel reply

You must be logged in to post a comment.

Voted #1 at Stock Charts

SH Chart
Inverse S&P 500 Fund (SH) will have a Money Wave Buy today.

Help Us Help Animals

Help Us Help Animals

Recent Comments

  • Money Wave Alert! Mar 27, 2023 – InvFuture Education on Money Wave Alert! Mar 27, 2023
  • Green Line Weekly! Mar 26, 2023 – InvFuture Education on Green Line Weekly! Mar 26, 2023
  • Green Line Weekly Mar 26, 2023 – InvFuture Education on Green Line Weekly Mar 26, 2023
  • AbovetheGreenLine on Money Wave Alert! Mar 22, 2023
  • Jesse Berry on Money Wave Alert! Mar 22, 2023

Become a Green Liner!

Help me make more Money in the Stock Market.

Above the Green Line

ON ATGL

  • Weekly Commentary
  • Intraday Buy / Sells
  • Day Trade Setup

STRATEGIES

  • Swing Trading
  • Dividend Growth
  • ETF Sector Rotation
  • Dogs of the Dow

HELP

  • ATGL Trading Rules
  • FAQ
  • Account Maintenance
  • Contact US

© Copyright 2021 · AboveTheGreenLine.com · All Rights Reserved · Privacy · Terms · Contact · WatchList · Current