
7/30/2023 Markets were higher for the week as the Leaders are retesting last week’s highs. The strongest Indices and Leaders must make more higher highs to negate the possible “M” or Double Top pattern. Eventually a Double Top will happen when the Leaders are very extended (Way Above the Green Lines). Historically Smart Money will take profits soon and Wait for a pull back. However, several stocks below that have been in 2 year Bear Markets are now beginning Stage 2 Bull Markets again.
Markets are moving up on the hope that Inflation has peaked and that the FED has Stop Tightening (raising short term (interest Rates). This is considered Good News and that is when Smart Money takes profits. This rally began in March on Bad News (Banking Crisis), and Smart Money loaded up… Undisciplined investors are buying now Way Above the Green Lines, and will Sell on the next Bad News (when we will be Buying again).
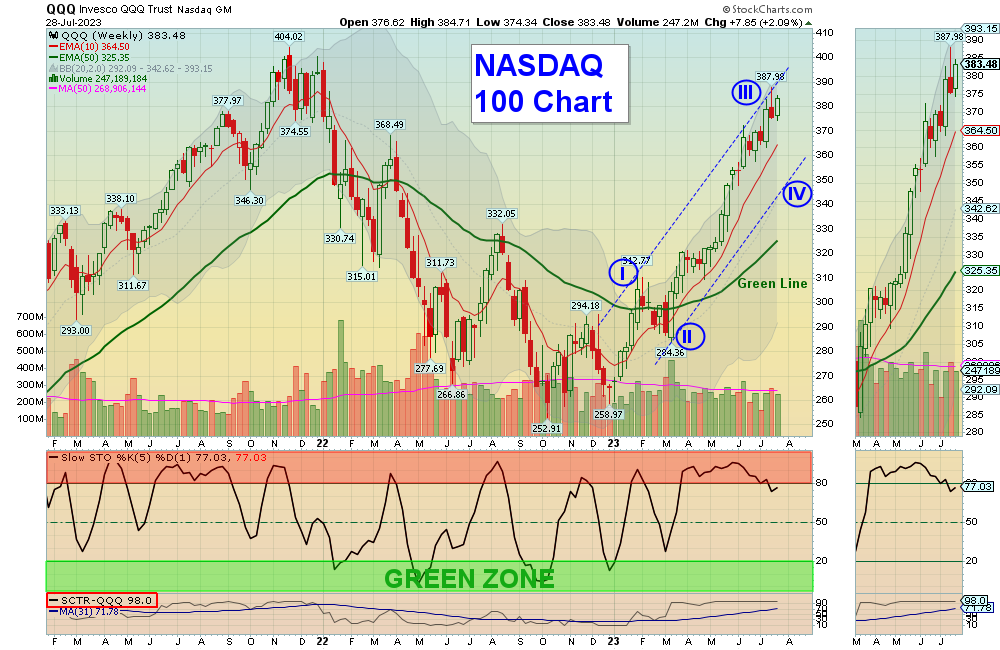
The NASDAQ 100 Fund is still going up on Wave 3 up , then it should have a 38% correction down near the 50-day avg. (count of 345). Greed and FOMO (Fear of Missing Out) have taken over, so normally there will be some profit taking soon. Currently the CNN Fear & Greed Index up at 78, the Greed Index (SVXY), and the Fear Index (VIX) are all telling Smart Money to take profits and Raise CASH.
If you continue to Follow the Green Line System, your Money should flow into the Strongest areas and your account value should be able to grow in both Bull and Bear Markets. Follow the MONEY, not the MEDIA.
_____________________________________________________________________________________________
For the week the Dow was up 0.66%, the S&P 500 was up 1.01% and the NASDAQ 100 was up 2.09%. Many of the major Indices still have a Relative Strength below 80, so you should currently own the stronger Funds here.
The Inflation Index (CRB) was up 1.45% for the week and is Above the Green Line, indicating Economic Expansion.
Bonds were down 1.89% for the week, and are Below the Green Line, indicating Economic Expansion.
The US DOLLAR was up 0.60% for the week and is Below the Green Line.
Crude Oil was up 4.55% for the week at $80.58 and GOLD was up 1.69% at $1999.90.
_____________________________________________________________________________________
We are now doing micro Day Trades on our new Discord site (free). Please join Discord on your cell phone app for mobile notifications during the day. Other methods of notification have been too slow. Also, please check our our Live Streaming on YouTube during Market hours.
More action this week on the Day Trading Scrolling Charts, and DAY TRADING CHARTS FOR INDICES & LARGE CAPS.
_____________________________________________________________________________________________
MONEY BUYS SOON:
We are in now in 5 logged Swing Trading Positions for the Short & Medium Term. There are 6 investments on the Short Term Watch List.
Be patient and WAIT for Green Zone Buy Signals!
LONG TERM INVESTMENTS:
Long Term Scrolling Charts (Real Time)
ASRT ASSERTIO HOLDINGS Weekly Money Wave Buy Signal was good for 6% pop, but the Volume was not high.
MGNI MAGNITE INC. Bought on Daily Money Wave Buy Signal at $14.62, but the Volume was not high.
OSTK OVERSTOCK.COM Buy above $39 with High Volume with a 5% Trailing Sell Stop Loss below it.
PINS PINTEREST INC. Buy above $30.86 with High Volume with a 3% Trailing Sell Stop Loss below it.
RDFN REDFIN CORP. Bought on Daily Money Wave Buy Signal at $15.27, but the Volume was not high.
SH INVERSE S&P 500 FUND Buy above $17.71 with High Volume with a 3% Trailing Sell Stop Loss below it.
STNE STONECO LTD. Buy above $15.01 with High Volume with a 3% Trailing Sell Stop Loss below it.
TAL TAL EDUCATION GROUP Buy above $10.45 with High Volume with a 3% Trailing Sell Stop Loss below it.
VKTX VIKING THERA. INC. Wait for Weekly Money Wave Close > 20 with High Volume.
WW WEIGHT WATCHERS INT’l. Wait for next Daily Money Wave Buy Signal with High Volume.
__________________________________________________________________________________________
My Trading Dashboard
Swing Trading Scrolling Charts
Day Trading Scrolling Charts
Click for Watch Lists
Click for Current Positions
Click for Closed Positions
Updated Top 100 List Jul 1, 2023
Dividend Growth Portfolio
Updated ETF Sector Rotation System
Dogs of the DOW System
Long Term Strategy for IRAs & 401k Plans
CNN Fear & Greed Index
Scrolling Stage Chart Investing Charts
Alert! Market Risk is High (RED). The probability of successful Short Term Trades is better, when the % of stocks above the 50-day avg. is below 20.
Tell your Friends about the Green Line, and Help Animals.
________________________________________________________________________________
5 Ways to Get your Daily Money Wave Email Alert:
-
- Emailed to your box between 3:45 – 3:50 pm EST.
- Website menu Commentary/Buy/Sell Signals
- Discord Chat. and Twitter @AboveGreenLine mobile notifications are the fastest (please set up “mobile notifications”)
- Text messages: Email us your Cell number & phone carrier.
Thank you,
ATGL
Related Post
– ASRT