Above the Green Line -01
  • Market Insights
        • Commentary
          • Daily
          • Weekly
        • BUY / SELL SIGNALS
          • Trade Posts
          • Recent Trade Alerts
          • Recent Day Trades
        • BLOGROLL
          • Dividend Growth Blog
          • ETF Sector Blog
          • Dow Dogs
          • TPOW Blog
  • Strategies
        • SWING TRADING
          • Current Positions
          • Watchlists
          • Closed Positions
          • Candidates - TOP 100
          • Specialty Stocks
        • WEEKLY STOCK PICK
          • TPOW Charts
          • TPOW Performance
          • TPOW Strategy Guide
          • TPOW Performance Dashboard
        • DAY TRADING
          • Watch List
        • ATGL DASHBOARD
        • ETF STRATEGIES
          • ETF Sector Rotation
          • ETF Sector Portfolio
        • DIVIDEND GROWTH
          • Dividend Growth Portfolio
          • Dividend Calendar
        • DOGS OF THE DOW
          • Dogs of the Dow Portfolio
          • DOW 5 Portfolio
  • Markets
        • US MARKET
          • Commodities
          • Energy
          • Precious Metals
          • Volatility
        • GLOBAL MARKETS
          • Market Indices
          • Economic Calendar
          • FOREX Heat Map
          • FOREX Cross Rates
          • Crypto Currency Market
  • Investing
    • Discord Community
    • Dashboard
  • Resources
        • ARTICLES
          • Dividend Growth Model Articles
          • ETF Articles
          • Investment Strategies Articles
          • Market and Economic Insights
          • Stock Trade Articles
          • Stock Reviews
        • TOOLS
          • Stock Scanners
          • Charting Software
          • Brokerage Firms
        • STOCK CHARTS
          • Key Components
          • Reading Charts
          • Drawing Stock Charts
          • Identifying Trends
        • RETIREMENT PLANNING
  • About
    • Contact Us
    • How to Win
    • #1 At Stockcharts
    • Disclaimer
    • FAQ
  • Log In
  • Subscribe

January 20, 2019

Green Line Weekly Jan 20, 2019

SPX Chart
S&P 500 Index is quickly back up to the Green Line.


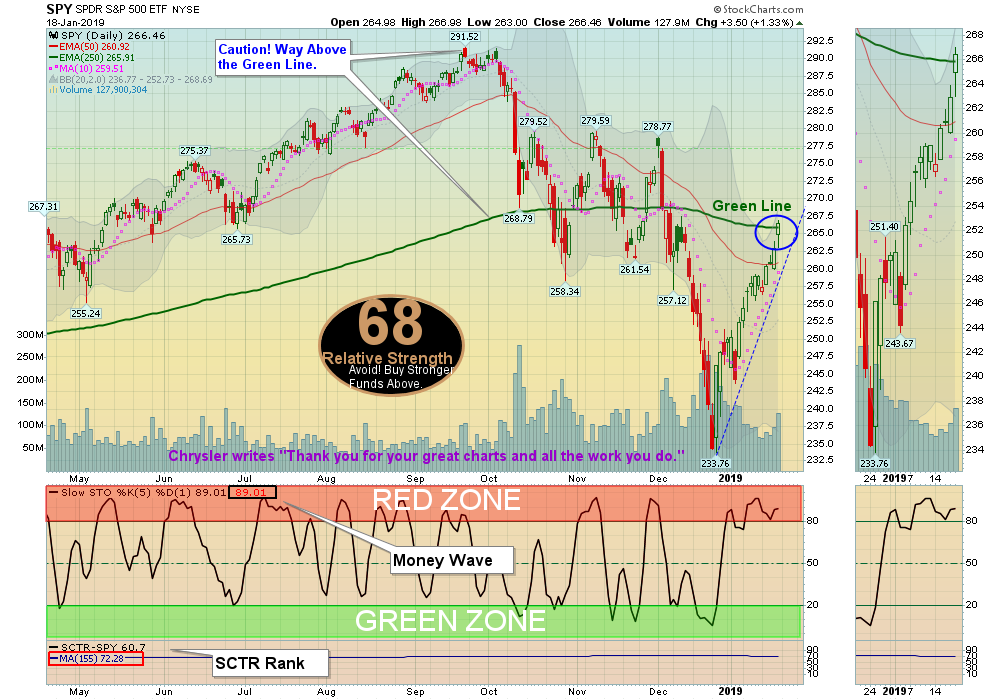
01/20/2019:  Markets  were up again this week as the Indices quickly rallied back up to their Green Lines (250-day avgs.)  The Green Line is more of a “Fair” value of an Investment (Way Above the Green Line is puffed up by GREED, & Way Below the Green Line is Over-Sold from FEAR).

Investor Sentiment has turned  much more positive according to the FEAR Index. Maybe some profit taking soon.

For the week the Dow was up 2.96%, the S&P 500 was up 2.89%, and the Nasdaq 100 was up 2.78%.   The very Long Term Trend on the Stock Markets is UP. 


The Inflation Index (CRB) was up 2.32% but is Below the Green Line, indicating Economic Weakness.

Bonds  were down  0.84% for the week and are Above the Green Line, indicating Economic Weakness.

The US DOLLAR  was up 0.79%, after becoming Over-Sold on the weekly chart.

Crude Oil was up 4.75% for the week at $54.04, and GOLD was down 0.54% at $1283.

___________________________________________________________________________________________

MONEY WAVE BUYS SOON:   

We are currently in 4 logged Open Positions, for the Short & Medium Term.  There are 2 Investments on the Short Term Watch List. 

Be patient and WAIT for Green Zone Buy Signals!

______________________________________________________________________________________________

LONG TERM TRADES 

Investments below that can Bounce up off the Green Line with Above 80 Relative Strength, could re-test their recent Highs.

   
ARWR    ARROWHEAD PHARMA.    Buy if it Closes above $15.47.   
CGC    CANOPY GROWTH     Try to Buy near the Red Line around  $35.09 (50-day avg.)   
FTNT    FORTINET INC.     Buy if it Closes above $75.29.     
GME    GAME STOP CORP.    Buy if it Closes above $16.90.     
GNW    GENWORTH FINANCIAL     Buy if it Closes above $5.27. 
I    INTELSAT GLOBAL    Wait for the next Daily Money Wave Buy Signal. 
MSFT    MICROSOFT CORP.    Try to Buy near the Red Line around  $104.60 (50-day avg.)        
UAL    UNITED CON’T. AIR     Wait for the next Daily Money Wave Buy Signal.     
VER    VEREIT, INC.    Buy if it Closes above $7.89. (7% Dividend)
   

___________________________________________________________________________________________


Click for  Portfolio (Open Positions)  
Click for  Watch List
Click for  Closed Positions


Alert! Market Risk is MEDIUM (Yellow Zone). The probability of successful Short Term Trades is better, when the S&P 500 is down near the Green Line. 

Tell your Friends about the Green Line, and Help Animals.


QUESTION:   Colin writes “I have followed the recommendations on the buy signals and had the recommended stop losses in. I have stopped out off all positions except one.   Ok that’s fine. But in your portfolio the position is still open. How can that be? I am confused as I may have done something wrong.

Please help me to get that right.

Thanks 

ANSWER:  Sorry for the confusion Colin… The Investment must CLOSE below the Support or Stop Price, to avoid whipsaws by the sleazy market makers.  Before the Close we send out the Money Wave Alert emails if there are any Changes to the Stops. 

Please check the “SELLS TODAY” section of each email where we warn of positions being Stopped Out on the Close.

Also, the PORTFOLIO PAGE is kept current before the Close with current Stops (on the Close only).

Hope this helps.

AGL

Related Post

– Green Line Weekly Jan 13, 2019

Subscribe to Our Newsletter

AGL Logo

Get our eBook Now!

Candlestick - A Swing Traders Friend

We don’t spam! Read our privacy policy for more info.

You’ve been successfully subscribed to our newsletter!

Voted #1 at Stock Charts

SH Chart
Inverse S&P 500 Fund (SH) will have a Money Wave Buy today.

Help Us Help Animals

Help Us Help Animals

Recent Comments

  • Market Breadth Indicators: A Trader’s Guide to Early Trend Detection on Backtesting: Definition and How a Trading Strategy Backtest Works
  • Island Reversal Pattern: Definition and Formation Explained on Double Top Pattern: How to Identify and Trade This Reversal Signal
  • Channel Pattern Guide: What It Is and Why It Matters on A Guide to Forecasting Using Moving Averages
  • What Is a Broadening Bottom Chart Pattern? Full Guide on Bull vs. Bear Market: An Investor’s Guide to Market Phases
  • ATGL Weekly Money Flow - 2025-05-11 on ATGL Top Pick of the Week! Apr 6, 2025

Become a Green Liner!

Help me make more Money in the Stock Market.

ON ATGL

  • DashBoard
  • Weekly Commentary
  • Daily Buy / Sell Signals
  • Day Trade Setup
  • Trading Rooms

Design & Develop By Pixelvect

STRATEGIES

  • Swing Trading
  • ATGL Pick of the Week
  • Dividend Growth
  • ETF Sector Rotation
  • Dogs of the Dow

HELP

  • ATGL Trading Rules
  • FAQ
  • Account Maintenance
  • Contact US
  • Join

FOLLOW US

Instagram Linkedin Twitter Facebook

© COPYRIGHT 2024 · ABOVETHEGREENLINE.COM · ALL RIGHTS RESERVED · PRIVACY · TERMS · CONTACT · WATCHLIST · CURRENT