
01/13/2019: Markets were up again this week as the Indices rallied up towards their Red Lines (50-day avgs.) Many of the weaker Investments that fell Way Below the Green Lines have popped up quite a bit, but only 37% of the S&P 500 Stocks are Above their Green Lines (250-day avgs.) That means that 63% of the S&P 500 Stocks are Inferior, and have downside risk.
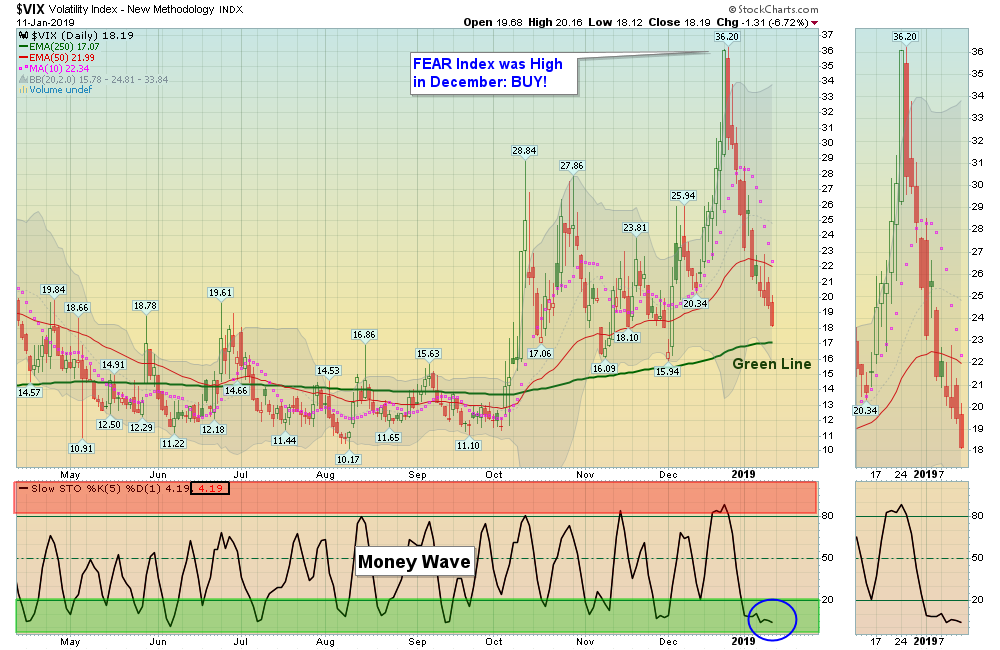
Investor Sentiment has turned more positive very quickly according to the FEAR Index (above). This could signal some profit taking soon, as many Leaders are up near their Red Zones (probably too late to Buy for the Short Term).
So Short Term Investors should be raising some Cash to be able to Buy on the next cycle down. If the next decline has Low Volume and won’t drop much, we could see a much larger rally up to the Green Line or Higher.
For the week the Dow was up 2.40%, the S&P 500 was up 2.61%, and the Nasdaq 100 was up 2.78%. The very Long Term Trend on the Stock Markets is UP, but many most major Indices are Below the Green Lines (avoid).
The Inflation Index (CRB) was up 2.73% but is Below the Green Line, indicating Economic Weakness.
Bonds were down 0.97% for the week and are Above the Green Line, indicating Economic Weakness.
The US DOLLAR was down 0.39%, and could be topping as the FED is probably finished Raising Rates for a while (unless they purposely want to create a Slow Down). A falling Dollar could be good for Tech Stocks and Commodities.
Crude Oil was up 7.57% for the week at $51.59, and GOLD was up 0.29% at $1290.
___________________________________________________________________________________________
MONEY WAVE BUYS SOON:
We are currently in 6 logged Open Positions, for the Short & Medium Term. There are 5 Investments on the Short Term Watch List.
Be patient and WAIT for Green Zone Buy Signals!
______________________________________________________________________________________________
LONG TERM TRADES
Investments below that can Bounce up off the Green Line with Above 80 Relative Strength, could re-test their recent Highs.
ARWR ARROWHEAD PHARMA. Up 12.8% this week. Try to Buy near the Red Line around $13.56 (50-day avg.)
BSX BOSTON SCIENTIFIC Up 4% this week. Try to Buy near the Red Line around $35.34 (50-day avg.)
CGC CANOPY GROWTH Up 35.5% this week. Try to Buy near the Red Line around $33.22 (50-day avg.)
FIVE FIVE BELOW Up 9% this week. Try to Buy near the Red Line around $107.01 (50-day avg.)
FTNT FORTINET INC. Up 9.5% this week. Try to Buy near the Red Line around $71.80 (50-day avg.)
I INTELSAT GLOBAL Place Buy Stop above $24.48 on the Close.
LULU LULULEMON ATHLETICA Buy on any pull-back near the Red Line of $127.39.
MA MASTERCARD Buy on any pull-back near the Red Line of $192.87.
MSFT MICROSOFT CORP. Wait for weekly Close Above the Red Line of $103.91 (50-day avg.)
NIHD NII HOLDINGS Up 18% this week. Try to Buy near the Red Line around $4.98 (50-day avg.)
UAL UNITED CON’T. AIR Wait for weekly Close Above the Red Line of $85.25 (50-day avg.)
WWE WORLD WRESTLING Closed above $77.95 Resistance, but the weekly Money Wave is already in the Red Zone. Place a Tight Sell Stop Below the Red Line of $74.64.
___________________________________________________________________________________________
Click for Portfolio (Open Positions)
Click for Watch List
Click for Closed Positions
Alert! Market Risk is MEDIUM (Yellow Zone). The probability of successful Short Term Trades is better, when the S&P 500 is down near the Green Line.
Tell your Friends about the Green Line, and Help Animals.
QUESTION: Jim D. writes” Hi there, I am a member but am still confused on how best to react to Money Wave Buy Signals. Thanks.”
ANSWER:
The Green Line System Buys High Volume & High Relative Strength Investments when they pull-back (Into the Green Zones).
Investments that are in the Green Zones (or “On Deck”) are on the Watch List. for you to Study.
When the Investment has a Buy Signal (Money Wave Closing above 20 and out of the Green Zone), we send out an email or text before the Mkt. Close.
Then Buy the Investment, and put in the Sell Stop Loss (based on closing price) to limit the risk… Then Monitor the PORTFOLIO page to update your Stop Loss, or wait for Daily Email for when to Sell.
It is that Simple! The System should have a lot of small losses if you use Stops, but the number of winning trades should be greater. This is a “Probability System” that is not perfect and won’t get you rich quick, but it should make more than it loses in any type of Market.
Good trading, and tell your friends!


