Above the Green Line -01
  • Market Insights
        • Commentary
          • Daily
          • Weekly
        • BUY / SELL SIGNALS
          • Trade Posts
          • Recent Trade Alerts
          • Recent Day Trades
        • BLOGROLL
          • Dividend Growth Blog
          • ETF Sector Blog
          • Dow Dogs
          • TPOW Blog
  • Strategies
        • SWING TRADING
          • Current Positions
          • Watchlists
          • Closed Positions
          • Candidates - TOP 100
          • Specialty Stocks
        • WEEKLY STOCK PICK
          • TPOW Charts
          • TPOW Performance
          • TPOW Strategy Guide
          • TPOW Performance Dashboard
        • DAY TRADING
          • Watch List
        • ATGL DASHBOARD
        • ETF STRATEGIES
          • ETF Sector Rotation
          • ETF Sector Portfolio
        • DIVIDEND GROWTH
          • Dividend Growth Portfolio
          • Dividend Calendar
        • DOGS OF THE DOW
          • Dogs of the Dow Portfolio
          • DOW 5 Portfolio
  • Markets
        • US MARKET
          • Commodities
          • Energy
          • Precious Metals
          • Volatility
        • GLOBAL MARKETS
          • Market Indices
          • Economic Calendar
          • FOREX Heat Map
          • FOREX Cross Rates
          • Crypto Currency Market
  • Investing
    • Discord Community
    • Dashboard
  • Resources
        • ARTICLES
          • Dividend Growth Model Articles
          • ETF Articles
          • Investment Strategies Articles
          • Market and Economic Insights
          • Stock Trade Articles
          • Stock Reviews
        • TOOLS
          • Stock Scanners
          • Charting Software
          • Brokerage Firms
        • STOCK CHARTS
          • Key Components
          • Reading Charts
          • Drawing Stock Charts
          • Identifying Trends
        • RETIREMENT PLANNING
  • About
    • Contact Us
    • How to Win
    • #1 At Stockcharts
    • Disclaimer
    • FAQ
  • Log In
  • Subscribe

February 28, 2021

Green Line Weekly Feb 28, 2021

DIA Chart
Markets need to bounce soon.

2/28/2021 Markets were down slightly for the week on profit taking and higher Interest Rates. Bonds dumped earlier in the week as the Treasury Department sold $62 billion of seven-year notes, and the auction did not go well.

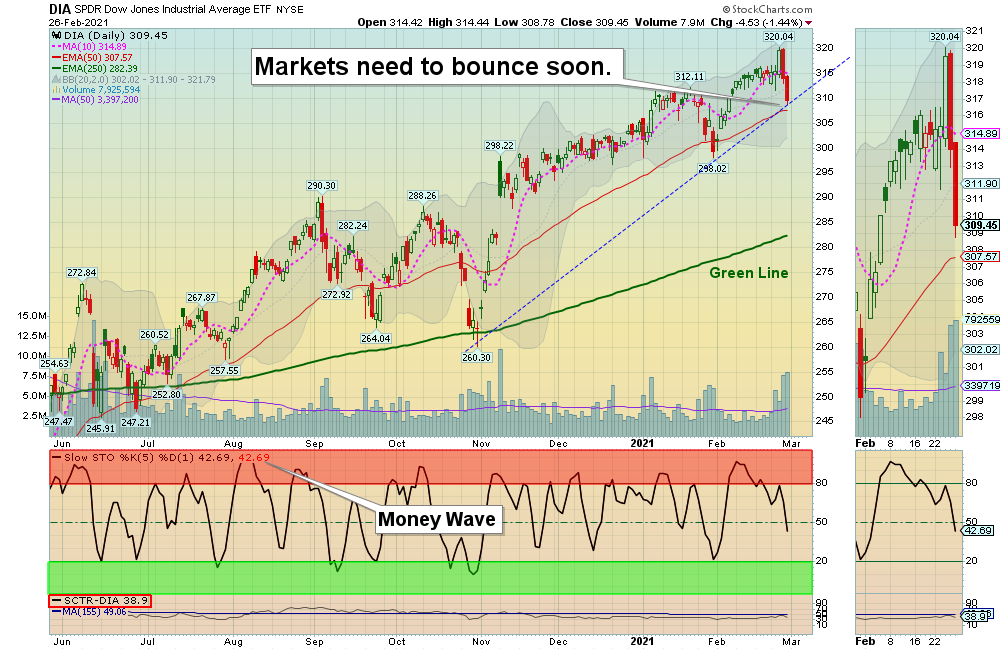
The Indices are down near the Red Lines (50-day avgs.) and need to bounce up soon for this rally to continue. Many are expecting another Stimulus Bill very soon, which could pop the Markets back up to re-test the recent Highs.

This Goldilocks Economy won’t last forever, so learn to trade the Waves or Cycles. Much of this 12 Year Bull Market is because of Low Interest Rates,  and we will have plenty of Leaders for you to Buy when Tammy’s Emotions flip again from “Get Me In”, to “Get Me Out!” Seasonal Buy Indicator

SEE SUPPLEMENTAL CHARTS

For the week the Dow was down 1.74%, the S&P 500 was down 2.48%, and the Nasdaq 100 was down 5.10%. The Long Term Trend for the Indices is up. 

The Inflation Index (CRB) was up 0.96% for the week and is Above the Green Line, indicating Economic Expansion.

Bonds were down 0.10% for the week, and are Below the Green Line, indicating Economic Expansion.

The US DOLLAR was up 0.70% for the week. 

Crude Oil was up 3.78% for the week at $61.50 and GOLD was down 2.73%  at $1728.80.

_____________________________________________________________________________________________

MONEY WAVE BUYS SOON

We are currently in 4 logged Current Positions, for the Short & Medium Term.  There are 5 Investments on the Short Term Watch List. 

Be patient and WAIT for Green Zone Buy Signals!

______________________________________________________________________________________________

LONG TERM INVESTMENTS  (Most of the Leaders are back up in the Weekly Red Zones.)

Currently very few Leading Investments that are down near the Weekly Green Zones. Caution.     

CBAY      CYMABAY THERA.      Buy if it Closes $6.56 on High Volume.    

GME      GAME STOP CORP.      Wait for Weekly Money Wave to Close > 20.

LL       LUMBER LIQUIDATORS      Wait for Weekly Money Wave to Close > 20.

MJ      MARIJUANA FUND       Wait for the next Daily Money Wave to Close > 20.     

XL      XL FLEET CORP.      Wait for the next Daily Money Wave to Close > 20.

______________________________________________________________________________________

Click for  Watch Lists
Click for  Current Positions
Click for  Closed Positions

New: My Trading Dashboard

Day Trading Watch List

NEW TOP 100 LIST Jan 31, 2021
Dividend Growth Portfolio  
ETF Sector Rotation System      
Dogs of the DOW System
Long Term Strategy for IRAs & 401k Plans
CNN Fear & Greed Index

Alert! Market Risk is MEDIUM (Yellow Zone). The probability of successful Short Term Trades is better, when the % of stocks above the 50-day avg. is below 20. 

Tell your Friends about the Green Line, and Help Animals.

___________________________________________________________________________________________

QUESTION:  Praveen  wrote “Hello ATGL.  I am not receiving alerts for the buy and sell I am just getting end of day link. can you please fix my problem. Thanks,

ANSWER: Hi Praveen. We currently have 1 email going out Daily, the Money Wave Avert! which is sent between 3:40 -3:50 EST.

We are sending out some Day Trading Tweets on Twitter @AboveGreenLine on Twitter

Most members follow the Watch List and My Trading Dashboard during the day, as they are constantly being updated.

We also have Live Streaming on YouTube, which has these current Watch Lists running “real time”.

Thank you for writing,

ATGL

Related Post

– Green Line Weekly Feb 21, 2021

Subscribe to Our Newsletter

AGL Logo

Get our eBook Now!

Candlestick - A Swing Traders Friend

We don’t spam! Read our privacy policy for more info.

You’ve been successfully subscribed to our newsletter!

Voted #1 at Stock Charts

SH Chart
Inverse S&P 500 Fund (SH) will have a Money Wave Buy today.

Help Us Help Animals

Help Us Help Animals

Recent Comments

  • Market Breadth Indicators: A Trader’s Guide to Early Trend Detection on Backtesting: Definition and How a Trading Strategy Backtest Works
  • Island Reversal Pattern: Definition and Formation Explained on Double Top Pattern: How to Identify and Trade This Reversal Signal
  • Channel Pattern Guide: What It Is and Why It Matters on A Guide to Forecasting Using Moving Averages
  • What Is a Broadening Bottom Chart Pattern? Full Guide on Bull vs. Bear Market: An Investor’s Guide to Market Phases
  • ATGL Weekly Money Flow - 2025-05-11 on ATGL Top Pick of the Week! Apr 6, 2025

Become a Green Liner!

Help me make more Money in the Stock Market.

ON ATGL

  • DashBoard
  • Weekly Commentary
  • Daily Buy / Sell Signals
  • Day Trade Setup
  • Trading Rooms

Design & Develop By Pixelvect

STRATEGIES

  • Swing Trading
  • ATGL Pick of the Week
  • Dividend Growth
  • ETF Sector Rotation
  • Dogs of the Dow

HELP

  • ATGL Trading Rules
  • FAQ
  • Account Maintenance
  • Contact US
  • Join

FOLLOW US

Instagram Linkedin Twitter Facebook

© COPYRIGHT 2024 · ABOVETHEGREENLINE.COM · ALL RIGHTS RESERVED · PRIVACY · TERMS · CONTACT · WATCHLIST · CURRENT