
2/21/2021 Markets were slightly lower for the week as weather and a Holiday slowed down the Volume. It has now more difficult to make Money with Stocks, as most are extended Way Above the Green Lines, and Smart Money has paused on Buying at these levels. But we see that Earnings have been better than expected, the FED is Printing, the Virus cycle has peaked, and probably another Stimulus Plan is coming. So the Media tells us the ALL IS WELL & BUY. Yes, that is lots of Good News!
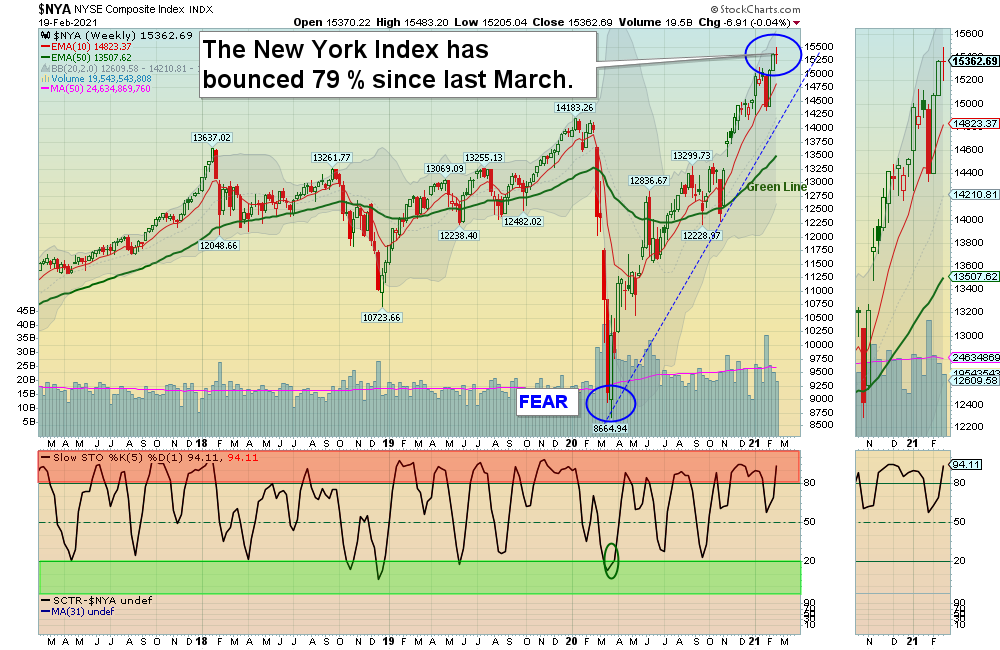
But if you want to be in with Smart Money, you need to know the Rules: Buy on BAD NEWS, and Sell on GOOD NEWS. Major Indices are up 80-170% since last March, and the next Correction could erase 25 -38 % of these Gains (back down near the Green Lines). You can HOPE that this does not happen, but history says it probably will. If you become upset on Market pull-backs, then Raise Cash up here so you will have Funds to Buy on the next BAD NEWS.
This Goldilocks Economy won’t last forever, so learn to trade the Waves or Cycles. Much of this 12 Year Bull Market is because of Low Interest Rates, and the Media reminds us that T-Bill Rates are down at only 0.23 %. But Long Term Interest Rates on T-Bonds are up 168 % in a year, from 0.85 % to 2.15 %. That is why many individual Leading Investments have not been able to make New Highs this time up and why T-Bond Prices are down 19 % in a year.
We will have plenty of Leaders for you to Buy when Tammy’s Emotions flip again from “Get Me In”, to “Get Me Out!” Seasonal Buy Indicator
For the week the Dow was up 0.15%, the S&P 500 was down 0.66%, and the Nasdaq 100 was down 1.61%. The Long Term Trend for the Indices is up.
The Inflation Index (CRB) was up 1.80% for the week and is Above the Green Line, indicating Economic Expansion.
Bonds were down 2.61% for the week, and are Below the Green Line, indicating Economic Expansion.
The US DOLLAR was down 0.16% for the week.
Crude Oil was down 0.35% for the week at $59.26 and GOLD was down 2.51% at $1777.40.
_____________________________________________________________________________________________
MONEY WAVE BUYS SOON
We are currently in only 1 logged Current Positions, for the Short & Medium Term. There are 10 Investments on the Short Term Watch List.
Be patient and WAIT for Green Zone Buy Signals!
______________________________________________________________________________________________
LONG TERM INVESTMENTS (Most of the Leaders are back up in the Weekly Red Zones.)
Currently very few Leading Investments that are down near the Weekly Green Zones. Caution.
CBAY CYMABAY THERA. Buy if it Closes $6.56 on High Volume.
GME GAME STOP CORP. Wait for Weekly Money Wave to Close > 20.
MJ MARIJUANA FUND Wait for the next Daily Money Wave to Close > 20.
X US STEEL CORP. Wait for Weekly Money Wave to Close > 20.
______________________________________________________________________________________
Click for Watch Lists
Click for Current Positions
Click for Closed Positions
New: My Trading Dashboard
NEW TOP 100 LIST Jan 31, 2021
Dividend Growth Portfolio
ETF Sector Rotation System
Dogs of the DOW System
Long Term Strategy for IRAs & 401k Plans
CNN Fear & Greed Index
Alert! Market Risk is HIGH (Red Zone). The probability of successful Short Term Trades is better, when the % of stocks above the 50-day avg. is below 20.
Tell your Friends about the Green Line, and Help Animals.
___________________________________________________________________________________________
QUESTION: Steve V. writes “Do you do both long and short positions or does someone just invert the rules in a down market?”
ANSWER: Yes, invert the Rules to Sell Short (Below G L, Below 10 R S, Dropping below 80 on Money Wave).
We will wait until the Market is in a Bear (below the Green Line), and not Short the next Correction back down to G L.
Once the Market is BEAR, we will manly do Inverse Funds, as most don’t understand Shorting…
The Leaders should have nice pops up if they hold above the G L after the Correction, and we don’t like to Sail into the Wind (FED).
Good trading and tell your friends!
ATGL