
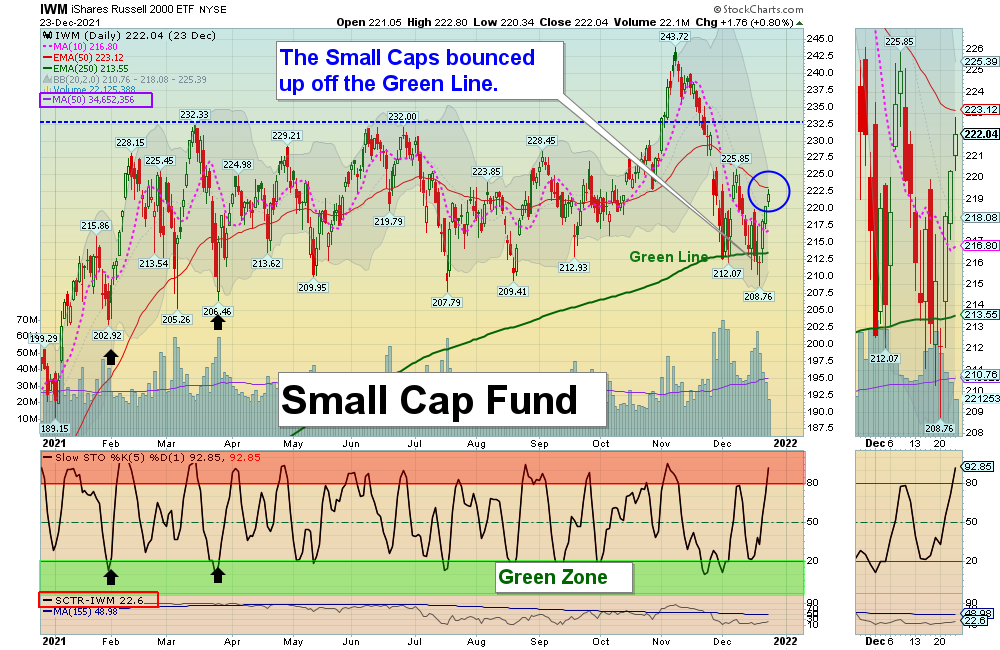
12/26/2021 Markets were higher for the week, as the Indices bounced up out of the Green Zones for Money Wave Buy Signals. Now the Indices need to make Higher Highs for the rally to continue. We should find out soon if the Markets can go higher without the FED propping it up as much as they did earlier this year.
After the End of the Year Tax Loss Selling on the Small Caps is over in five days, maybe the Money will rotate back into the Small Caps again.
The Markets should do ok as long as Treasury Bond prices hold up (low long term Interest Rates). Currently Stock and Bond Investments are still about the only place for the Herd to have their Money. Lately Defensive Funds like Consumer Staples and Utilities have become stronger, in anticipation of a slower Economy.
If you continue to Follow the Green Line System, your Money should flow into the Strongest areas and your account value should be able to grow in both Bull and Bear Markets.
There has been plenty of action on the Day Trading Scrolling Charts.
NEW! DAY TRADING CHARTS FOR INDICES & LARGE CAPS.
We have not had many intra-day Stocks Alerts lately as the Volume has been too Low on Buy Signals. We like to see High Volume on rallies.
For the week the Dow was up 1.62%, the S&P 500 was up 2.33%, and the NASDAQ 100 was up 3.25%. The Long Term Trend for the Indices is up.
The Inflation Index (CRB) was up 2.56% for the week and is Above the Green Line, indicating Economic Expansion.
Bonds were down 1.53% for the week, but are back Above the Green Line, indicating Economic Contraction.
The US DOLLAR was down 0.58% for the week and is Above the Green Line.
Crude Oil was up 4.34% for the week at $73.79, and GOLD was up 0.38% at $1811.70.
_____________________________________________________________________________________________
MONEY WAVE BUYS SOON
We are currently in 9 logged Current Positions, for the Short & Medium Term. There is only 1 investment on the Short Term Watch List.
Be patient and WAIT for Green Zone Buy Signals!
_________________________________________________________________________________________
LONG TERM INVESTMENTS (many Large Caps no longer have 80 Relative Strength required.)
Long Term Scrolling Charts (Real Time)
BCRX BIOCRYST PHARMA. Up another 6.83% this week, but is almost back up in the weekly Red Zone. Avoid.
BTU PEABODY ENERY CORP. Shot up 8.76% this week. Buy if it Closes above $11.23 with High Volume.
DBC COMMODITY FUND Closed above the Red Line (50-day avg.) but the Volume was not High. Wait for the next Daily Money Wave Buy Signal.
DKS DICKS SPORTING GOODS Wait for the next Daily Money Wave Buy Signal.
ERJ EMBRAER AIRCRAFT Shot 16% this week on average Volume.
M MACY’S INC. Buy if it Closes above the Red Line (50-day avg.) with High Volume.
RRC RANGE RESOURCES CORP. Buy if it Closes above $19.44 with High Volume.
UPST UPSTART HOLDINGS Buy if it Closes above the Green Line (250-day avg.) with High Volume.
____________________________________________________________________________________
My Trading Dashboard
Swing Trading Scrolling Charts
Day Trading Scrolling Charts
Click for Watch Lists
Click for Current Positions
Click for Closed Positions
Updated Top 100 List Dec 1, 2021
Dividend Growth Portfolio
ETF Sector Rotation System
Dogs of the DOW System
Long Term Strategy for IRAs & 401k Plans
CNN Fear & Greed Index
Scrolling Stage Chart Investing Charts
Alert! Market Risk is MEDIUM (Yellow Zone). The probability of successful Short Term Trades is better, when the % of stocks above the 50-day avg. is below 20.
Tell your Friends about the Green Line, and Help Animals.
______________________________________________________________________________________
QUESTION: Winter writes ““Don’t take a Loss” confuses me. What does that mean?”
ANSWER: When the Investment has a Money Wave Buy Signal, it should pop up 3-6 % in just a few days.
If it is not popping up well, and the Money Wave > 50, either Get the H out, or Don’t Take a Loss!
Something must be Wrong. There will be plenty more… Raise Cash, and don’t get Stuck! Wait for the next one.
Good trading and tell your friends!
ATGL