Above the Green Line -01
  • Market Insights
        • Commentary
          • Daily
          • Weekly
        • BUY / SELL SIGNALS
          • Trade Posts
          • Recent Trade Alerts
          • Recent Day Trades
        • BLOGROLL
          • Dividend Growth Blog
          • ETF Sector Blog
          • Dow Dogs
          • TPOW Blog
  • Strategies
        • SWING TRADING
          • Current Positions
          • Watchlists
          • Closed Positions
          • Candidates - TOP 100
          • Specialty Stocks
        • WEEKLY STOCK PICK
          • TPOW Charts
          • TPOW Performance
          • TPOW Strategy Guide
          • TPOW Performance Dashboard
        • DAY TRADING
          • Watch List
        • ATGL DASHBOARD
        • ETF STRATEGIES
          • ETF Sector Rotation
          • ETF Sector Portfolio
        • DIVIDEND GROWTH
          • Dividend Growth Portfolio
          • Dividend Calendar
        • DOGS OF THE DOW
          • Dogs of the Dow Portfolio
          • DOW 5 Portfolio
  • Markets
        • US MARKET
          • Commodities
          • Energy
          • Precious Metals
          • Volatility
        • GLOBAL MARKETS
          • Market Indices
          • Economic Calendar
          • FOREX Heat Map
          • FOREX Cross Rates
          • Crypto Currency Market
  • Investing
    • Discord Community
    • Dashboard
  • Resources
        • ARTICLES
          • Dividend Growth Model Articles
          • ETF Articles
          • Investment Strategies Articles
          • Market and Economic Insights
          • Stock Trade Articles
          • Stock Reviews
        • TOOLS
          • Stock Scanners
          • Charting Software
          • Brokerage Firms
        • STOCK CHARTS
          • Key Components
          • Reading Charts
          • Drawing Stock Charts
          • Identifying Trends
        • RETIREMENT PLANNING
  • About
    • Contact Us
    • How to Win
    • #1 At Stockcharts
    • Disclaimer
    • FAQ
  • Log In
  • Subscribe

December 20, 2020

Green Line Weekly Dec 20, 2020

XRT Chart
The Retail Fund (XRT)  is up 142 % since March.

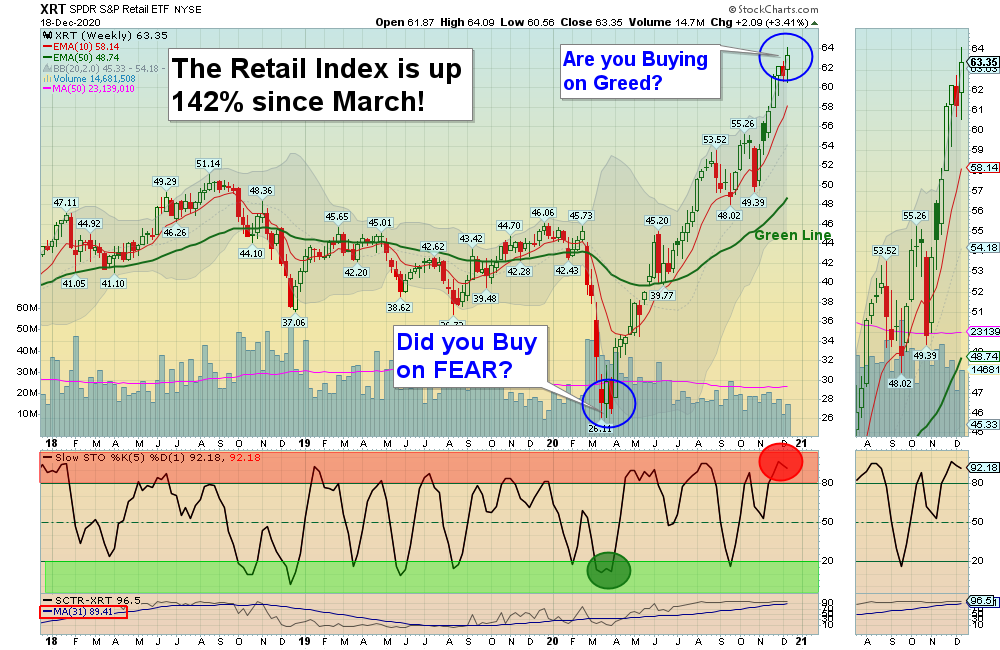
12/20/2020 Markets were up slightly for the week, and most of the major Indices made New Highs.  As you can see from the Chart above, the Retail Fund is as about as far Above the Green Line as it was Below the Green Line in March. We are lucky that the Markets move violently up and down because of the two Human Emotions: Fear & Greed. That way we can Buy when Investments are Low (FEAR), and take profits when all is well (GREED). Tammy sold in March because she was scared, and now she is almost fully invested again.

The Herd is Buying on expectations that the World Economy will improve dramatically when the Virus is over. Many are asking how high can the Markets go? We know from history that Markets will stretch Way Above the Green Lines on Greed, and then snap back down to the Green Line again. Obviously the Markets have already discounted most of the improvement of the World Economy in the future. If you believe that things are different this time, you could learn a painful lesson.

Lots of Good News on the Markets, and Smart Money should take profits and Sell soon after the Good news of another Stimulus Plan. 

SEE SUPPLEMENTAL CHARTS

Completed Trades this week:

Grayscale Bitcoin Trust (GBTC)   +21.2%
MoneyGram Int’l. (MGI)    +10.6%   

For the week the Dow was up 0.44%, the S&P 500 was up 1.22%, and the Nasdaq 100 was up 2.72%. The Long Term Trend for the Indices is up. 

The Inflation Index (CRB) was up 3.23% and is Above the Green Line, indicating Economic Expansion.

Bonds were down 1.43% for the week, and are Above the Green Line, indicating Economic Weakness.

The US DOLLAR was down 1.14% for the week, another New Low. 

Crude Oil was up 5.73% for the week at $49.24 and GOLD was up 2.46%  at $1888.90.

_____________________________________________________________________________________________

MONEY WAVE BUYS SOON

We are currently in 3 logged Current Positions, for the Short & Medium Term.  There are 3 Investments on the Short Term Watch List. 

Be patient and WAIT for Green Zone Buy Signals!

______________________________________________________________________________________________

LONG TERM INVESTMENTS  (Most of the Leaders are back up in the Weekly Red Zones.)

Buy the Leading Investments that are down near the Weekly Green Zones.      

CRON      CRONOS GROUP      Buy if it Closes above $9.00 on High Volume.      

LAC      LITHIUM AMERICAS CORP.      Buy if it Closes above the Red Line (50-day avg.) on High Volume.

NLS      NAUTILUS GROUP      Was bought this week at $17.99. Target is $26.00. EXIT if it is going to Close below $16.12.

RIOT      RIOT BLOCKCHAIN      Wait for the next Daily Money Wave Buy Signals.

______________________________________________________________________________________

Click for  Current Positions
Click for  Watch List
Click for  Closed Positions

New: My Trading Dashboard

Penny Stock & Low Volume Investments Watch List

TOP 100 LIST Dec 3, 2020

Dividend Growth Portfolio  

ETF Sector Rotation System 

Dogs of the DOW System

Long Term Strategy for IRAs & 401k Plans

CNN Fear & Greed Index

Alert! Market Risk is HIGH (Red Zone). The probability of successful Short Term Trades is better, when the % of stocks above the 50-day avg. is below 20. 

Tell your Friends about the Green Line, and Help Animals.

___________________________________________________________________________________________

QUESTION:  Jose M writes “Morning, I seem to have difficulties on finding the Money Wave chart on the ETFs. Thanks.”

ANSWER:  First go to MY TRADING DASH BOARD.  Then the Charts with the Money Waves can be pulled up by clicking on the Symbol of the Investment on the  Watch List  or Current Positions links in every Daily email.

The Money Wave is the Red and Green Zone on the bottom part of the Chart. Buy when the Money Wave has gone down into the Green Zone, and then turns up above 20. 

Related Post

– Green Line Weekly Dec 13, 2020

Subscribe to Our Newsletter

AGL Logo

Get our eBook Now!

Candlestick - A Swing Traders Friend

We don’t spam! Read our privacy policy for more info.

You’ve been successfully subscribed to our newsletter!

Voted #1 at Stock Charts

SH Chart
Inverse S&P 500 Fund (SH) will have a Money Wave Buy today.

Help Us Help Animals

Help Us Help Animals

Recent Comments

  • Market Breadth Indicators: A Trader’s Guide to Early Trend Detection on Backtesting: Definition and How a Trading Strategy Backtest Works
  • Island Reversal Pattern: Definition and Formation Explained on Double Top Pattern: How to Identify and Trade This Reversal Signal
  • Channel Pattern Guide: What It Is and Why It Matters on A Guide to Forecasting Using Moving Averages
  • What Is a Broadening Bottom Chart Pattern? Full Guide on Bull vs. Bear Market: An Investor’s Guide to Market Phases
  • ATGL Weekly Money Flow - 2025-05-11 on ATGL Top Pick of the Week! Apr 6, 2025

Become a Green Liner!

Help me make more Money in the Stock Market.

ON ATGL

  • DashBoard
  • Weekly Commentary
  • Daily Buy / Sell Signals
  • Day Trade Setup
  • Trading Rooms

Design & Develop By Pixelvect

STRATEGIES

  • Swing Trading
  • ATGL Pick of the Week
  • Dividend Growth
  • ETF Sector Rotation
  • Dogs of the Dow

HELP

  • ATGL Trading Rules
  • FAQ
  • Account Maintenance
  • Contact US
  • Join

FOLLOW US

Instagram Linkedin Twitter Facebook

© COPYRIGHT 2024 · ABOVETHEGREENLINE.COM · ALL RIGHTS RESERVED · PRIVACY · TERMS · CONTACT · WATCHLIST · CURRENT