Above the Green Line -01
  • Market Insights
        • Commentary
          • Daily
          • Weekly
        • BUY / SELL SIGNALS
          • Trade Posts
          • Recent Trade Alerts
          • Recent Day Trades
        • BLOGROLL
          • Dividend Growth Blog
          • ETF Sector Blog
          • Dow Dogs
          • TPOW Blog
  • Strategies
        • SWING TRADING
          • Current Positions
          • Watchlists
          • Closed Positions
          • Candidates - TOP 100
          • Specialty Stocks
        • WEEKLY STOCK PICK
          • TPOW Charts
          • TPOW Performance
          • TPOW Strategy Guide
          • TPOW Performance Dashboard
        • DAY TRADING
          • Watch List
        • ATGL DASHBOARD
        • ETF STRATEGIES
          • ETF Sector Rotation
          • ETF Sector Portfolio
        • DIVIDEND GROWTH
          • Dividend Growth Portfolio
          • Dividend Calendar
        • DOGS OF THE DOW
          • Dogs of the Dow Portfolio
          • DOW 5 Portfolio
  • Markets
        • US MARKET
          • Commodities
          • Energy
          • Precious Metals
          • Volatility
        • GLOBAL MARKETS
          • Market Indices
          • Economic Calendar
          • FOREX Heat Map
          • FOREX Cross Rates
          • Crypto Currency Market
  • Investing
    • Discord Community
    • Dashboard
  • Resources
        • ARTICLES
          • Dividend Growth Model Articles
          • ETF Articles
          • Investment Strategies Articles
          • Market and Economic Insights
          • Stock Trade Articles
          • Stock Reviews
        • TOOLS
          • Stock Scanners
          • Charting Software
          • Brokerage Firms
        • STOCK CHARTS
          • Key Components
          • Reading Charts
          • Drawing Stock Charts
          • Identifying Trends
        • RETIREMENT PLANNING
  • About
    • Contact Us
    • How to Win
    • #1 At Stockcharts
    • Disclaimer
    • FAQ
  • Log In
  • Subscribe

April 1, 2018

Green Line Weekly Apr 1, 2018

DIA Chart
DOW can Return to Highs if it can get Above Blue DownTrend Line.


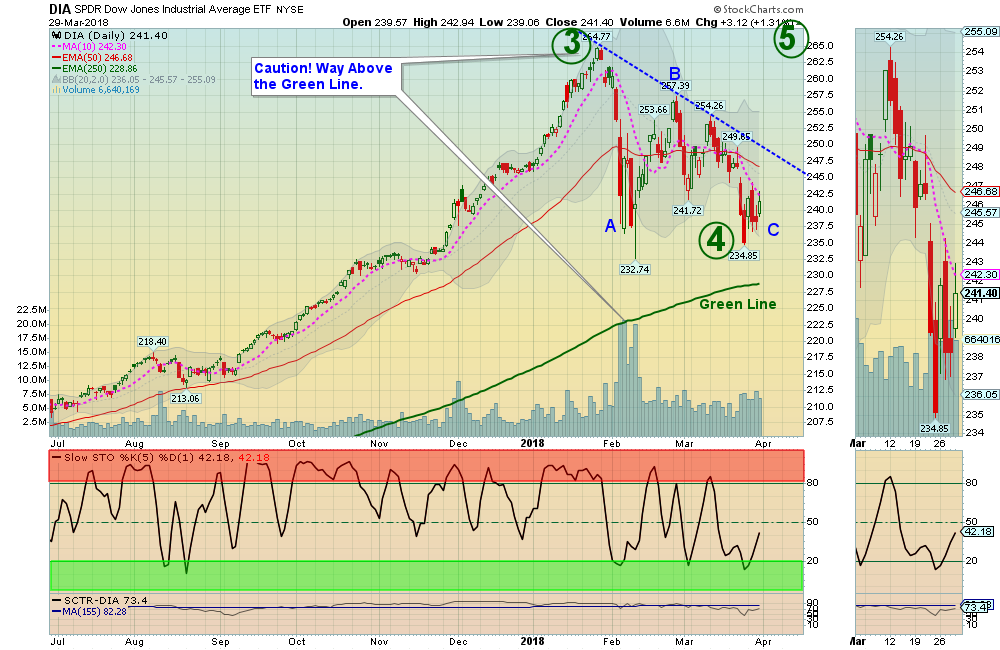
04/01/2018:  Markets were up over 2% for the week, as the Indices are trying to bounce near the February Lows. If the Markets can hold and bounce soon, we could see a “W” Pattern for the Indices to Bounce near the Green Lines and possibly re-test the Jan Highs.

The NASDAQ 100 Index and Techs are still below their Red Lines (50-day avgs.), so the first bounces will probably not be that good (resistance near the Red Lines). Try to Buy Investments that are still Above the Red Lines. The Long Term Trend is UP.

The Strongest Leaders are Holding Above their Red Lines.  The list of Large Caps that should bounce the best: MU INTC CSCO HPE NFLX M NTNX STX ADBE PGR GERN VIPS ADSK TPR NTAP EL RHT EW & AKAM. Many are so strong that they have not even returned to their Green Zones for Buy Signals.


Bonds are bearish (Below the Green Line and Low Relative Strength) but have rallied way back up to the Green Line (250-day avg.) on fear of Economic weakness.

The Inflation Index (CRB) is struggling to get back above the 196.36 Break Out level, which shows some weakness with Inflation. The US DOLLAR failed again the Red Line, and is re-testing the recent Lows.

Crude Oil was down 0.90% for the week at $65.00, and GOLD was down 1.70%.

___________________________________________________________________________________________

MONEY WAVE BUYS SOON:    We are currently in 7 logged Open Positions, for the Short & Medium Term. There are 8 Investments on the Short Term Watch List.  Be patient and WAIT for Green Zone Buys!

______________________________________________________________________________________________

LONG TERM TRADES 

The Funds below are currently out of favor and and recent news has cause more weakness. Some are having trouble with nice uptrends. But historically these could possibly Double or more from these lower levels. We are looking for a good Entry Point for these, but need the entire Economy  & Inflation to pick up speed:

DBC   COMMODITY FUND   Relative Strength is back Below 90.
KOL    COAL FUND        Relative Strength is back Below 90.
REMX   RARE EARTH FUND    Relative Strength is back Below 90.
TWTR   TWITTER INC.   Broke Out Above $25.85. Buy on next Daily Buy Signal.

___________________________________________________________________________________________

Click for  Portfolio (Open Positions)  
Click for  Watch List
Click for  Closed Positions


Alert! Market Risk is LOW (Green Zone). The probability of successful Short Term Trades is higher, when the S&P 500 is down near the Green Line. The Strongest Investments could re-test their Highs from these Over-Sold levels.


Tell your Friends about the Green Line, and Help Animals.


QUESTION:   Rocky writes “Curious as to why the SCTR rankings (StockCharts Technical Rank) on the ETFs are not used when they are with stocks.

Also, why are the ETF.com > 90 ETF rankings better than the SCTR > 90 ETF rankings?

Thank you in advance for your response!”

ANSWER:   Hi Rocky.  The SCTR from StockCharts is convenient on each Chart, but is weighted heavily to the last 90 days of trading (too volatile).  We prefer the 1 year weightings on ETF Screen or IBD (Investors Business Daily), as the Relative Strength does not hop around as much.

Relative Strength Values comes from the SCTR Rank (StockCharts Technical Rank), www.etfscreen.com for ETFs , and Investor’s Business Daily (IBD) for stocks. We prefer the longer term weighting used by www.etfscreen.com and IBD.

Good trading, and tell your friends!


Related Post

– Green Line Weekly Mar 25, 2018

Subscribe to Our Newsletter

AGL Logo

Get our eBook Now!

Candlestick - A Swing Traders Friend

We don’t spam! Read our privacy policy for more info.

You’ve been successfully subscribed to our newsletter!

Voted #1 at Stock Charts

SH Chart
Inverse S&P 500 Fund (SH) will have a Money Wave Buy today.

Help Us Help Animals

Help Us Help Animals

Recent Comments

  • Market Breadth Indicators: A Trader’s Guide to Early Trend Detection on Backtesting: Definition and How a Trading Strategy Backtest Works
  • Island Reversal Pattern: Definition and Formation Explained on Double Top Pattern: How to Identify and Trade This Reversal Signal
  • Channel Pattern Guide: What It Is and Why It Matters on A Guide to Forecasting Using Moving Averages
  • What Is a Broadening Bottom Chart Pattern? Full Guide on Bull vs. Bear Market: An Investor’s Guide to Market Phases
  • ATGL Weekly Money Flow - 2025-05-11 on ATGL Top Pick of the Week! Apr 6, 2025

Become a Green Liner!

Help me make more Money in the Stock Market.

ON ATGL

  • DashBoard
  • Weekly Commentary
  • Daily Buy / Sell Signals
  • Day Trade Setup
  • Trading Rooms

Design & Develop By Pixelvect

STRATEGIES

  • Swing Trading
  • ATGL Pick of the Week
  • Dividend Growth
  • ETF Sector Rotation
  • Dogs of the Dow

HELP

  • ATGL Trading Rules
  • FAQ
  • Account Maintenance
  • Contact US
  • Join

FOLLOW US

Instagram Linkedin Twitter Facebook

© COPYRIGHT 2024 · ABOVETHEGREENLINE.COM · ALL RIGHTS RESERVED · PRIVACY · TERMS · CONTACT · WATCHLIST · CURRENT