
By ATGL
Updated July 4, 2025
Technical analysis provides traders with powerful tools to identify potential market reversals before they occur. The diamond bottom pattern represents one of the most compelling bullish reversal signals in technical analysis, offering experienced traders’ opportunities to capitalize on significant trend changes.
This guide explores the diamond bottom chart pattern, covering pattern recognition, confirmation techniques, and proven trading strategies. You’ll learn how to identify this formation early, validate breakouts with volume analysis, and implement risk management techniques that maximize profit while protecting capital.
How the Diamond Bottom Pattern Forms
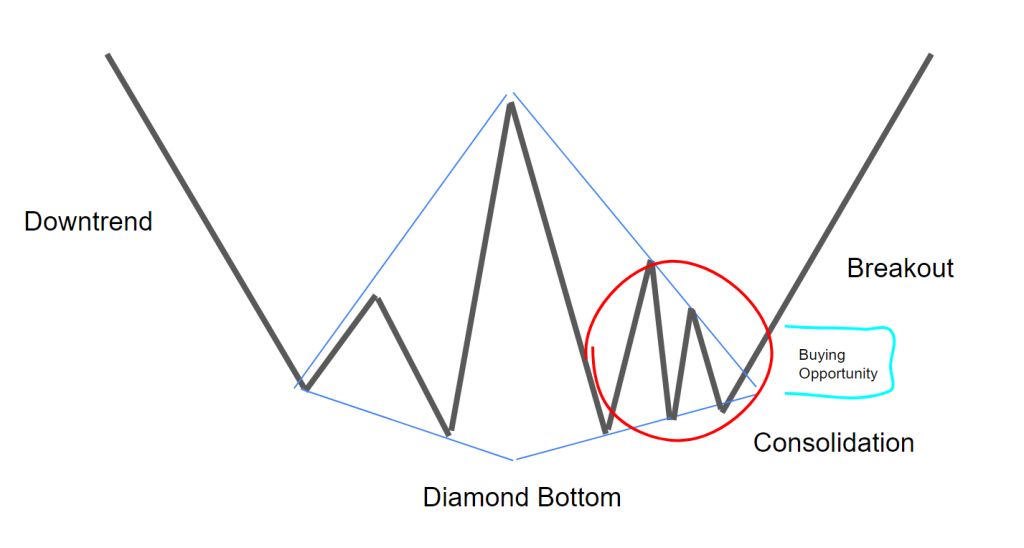
The diamond bottom pattern emerges when market sentiment shifts from bearish to bullish following a sustained downtrend. This formation occurs as selling pressure gradually diminishes while buying interest begins to accumulate, creating a distinctive diamond-shaped consolidation period.
During development, price action creates symmetrical highs and lows that form the diamond’s boundaries. The initial phase shows declining volatility as the downtrend loses momentum, followed by increasing volatility as buyers and sellers battle for control. This expansion and subsequent contraction creates the characteristic diamond shape.
The pattern typically develops over several weeks to months, requiring patience from traders who recognize its formation. Volume patterns reveal important insights about validity — declining volume during consolidation suggests diminishing selling pressure, while increasing volume near breakout confirms renewed buying interest.
5 Features of a Diamond Bottom Pattern
Several distinctive characteristics separate the diamond bottom pattern from other popular trading patterns, making it a reliable bullish reversal signal.
Symmetry and Structure
The pattern’s most recognizable feature involves its symmetrical appearance, with price action creating roughly equal highs and lows on both sides. This symmetry reflects balanced market forces as buyers gradually overcome sellers, establishing support and resistance levels that define the diamond’s boundaries.
The pattern typically consists of four main points: two higher points forming the top and two lower points creating the bottom boundary.
Relation to Previous Downtrend
A valid diamond bottom pattern must follow a significant downtrend, establishing the bearish sentiment that the pattern ultimately reverses. Without this prior decline, the formation lacks the context necessary for a Tomeaningful bullish reversal signal.
Additional features include expanding volume during breakout, timeframe completion over weeks to months, and potential false breakouts before genuine reversal. The diamond bottom pattern is inherently bullish, representing a shift from bearish to bullish market sentiment.
How To Spot the Pattern Early: Key Signs To Watch For
Recognizing diamond bottom patterns early requires attention to specific market conditions and price behaviors. The diamond pattern condition involves several technical factors that experienced traders monitor closely.
Initial signs include declining volatility following a sustained downtrend, where daily price ranges contract after extended bearish movement. This compression suggests selling pressure is diminishing.
Watch for price action creating higher lows while forming lower highs, establishing diverging trend lines that form the diamond’s boundaries. Volume analysis provides crucial indicators – declining volume during consolidation suggests reduced selling pressure, while increased volume during minor rallies may indicate accumulation.
Monitor key support levels established during the downtrend, as these areas often serve as the lower bouTondary for diamond bottom patterns.
When To Enter a Trade
Successful diamond bottom pattern trading requires precise timing and confirmation techniques that validate the reversal signal before position commitment.
Breakout Candle Confirmation & Retest of Breakout Level
The most reliable entry occurs when price definitively breaks above the diamond’s upper boundary with strong volume confirmation. This breakout should demonstrate clear momentum with decisive close above resistance, preferably accompanied by volume exceeding recent averages by at least 50%.
Wait for complete candle close above breakout level rather than entering on intraday movements. Many successful breakouts experience a retest within days or weeks, providing excellent secondary entry opportunities.
During retest, volume should remain light compared to breakout volume, indicating subdued selling pressure. Consider limit orders slightly above breakout level to capture moves while avoiding higher momentum prices.
The Do’s and Don’ts of Trading the Diamond Bottom Pattern
Effective diamond bottom pattern trading requires adherence to proven principles while avoiding common mistakes that can undermine profitability.
Do’s:
- Wait for complete pattern formation before entering positions. Premature entries often result in losses when patterns fail to develop properly, as rushing into trades frequently catches traders in false breakouts before genuine reversal patterns occur.
- Use volume analysis to confirm breakouts. Genuine reversals demonstrate increased buying interest through higher volume, which distinguishes authentic breakouts from false signals that fail and return to consolidation ranges.
- Implement proper position sizing based on entry-to-stop distance. This approach manages risk effectively while allowing trades to develop, using fixed capital percentages rather than arbitrary amounts to prevent excessive losses on single trades.
- Place stop-loss orders below the pattern’s lower boundary. This level provides logical risk management at a clear invalidation point where the bullish thesis no longer holds, limiting losses if patterns fail to perform.
Don’ts:
- Don’t ignore broader market context when trading individual patterns. Strong formations can fail during severe downturns or extreme volatility, as market conditions significantly influence pattern success rates regardless of individual pattern quality.
- Don’t chase breakouts that have moved significantly higher without confirmation. Late entries create poor risk-reward ratios and increase likelihood of buying near short-term tops, often resulting in immediate losses as initial momentum fades.
- Don’t use excessive leverage or inadequate position sizing. This mistake amplifies normal market volatility into significant losses and creates psychological pressure that leads to poor decision-making and premature exits from winning positions.
- Don’t enter based on incomplete volume confirmation. Breakouts without supporting volume often represent false signals that quickly reverse, as volume provides the fuel for sustained movements and indicates genuine institutional interest.
Successful integration into broader investment strategies requires combining pattern recognition with other trading patterns and technical stock analysis.
Use Pattern Recognition To Sharpen Your Edge
Diamond bottom pattern trading represents one component of comprehensive analysis combining multiple technical indicators and market insights. The most successful traders combine diamond bottom analysis with other technical methods, creating robust trading frameworks that validate signals and improve timing.
Advanced pattern recognition becomes increasingly valuable as markets evolve, and institutional algorithms influence price action. Above the Green Line’s comprehensive membership program provides access to advanced pattern recognition tools, professional-grade market analysis, and proven strategies that incorporate diamond bottom patterns into broader market timing systems.
Discover how our advanced analytical tools can enhance your pattern recognition capabilities and improve trading results through professional-grade market timing strategies.

Related Articles

Margin Call Explained: What Triggers It and How to Avoid One

AMC Short Squeeze Explained: Timeline, Causes, and Trading Risks

Volatility Clustering in Financial Markets: Understand Why It Happens

Chaikin Money Flow (CMF): How to Use Volume to Spot Real Market Strength
