Above the Green Line -01
  • Market Insights
        • Commentary
          • Daily
          • Weekly
        • BUY / SELL SIGNALS
          • Trade Posts
          • Recent Trade Alerts
          • Recent Day Trades
        • BLOGROLL
          • Dividend Growth Blog
          • ETF Sector Blog
          • Dow Dogs
          • TPOW Blog
  • Strategies
        • SWING TRADING
          • Current Positions
          • Watchlists
          • Closed Positions
          • Candidates - TOP 100
          • Specialty Stocks
        • WEEKLY STOCK PICK
          • TPOW Charts
          • TPOW Performance
          • TPOW Strategy Guide
          • TPOW Performance Dashboard
          • Why Weekly Trading Works
        • DAY TRADING
          • Watch List
        • ATGL DASHBOARD
        • ETF STRATEGIES
          • ETF Sector Rotation
          • ETF Sector Portfolio
        • DIVIDEND GROWTH
          • Dividend Growth Portfolio
          • Dividend Calendar
        • DOGS OF THE DOW
          • Dogs of the Dow Portfolio
          • DOW 5 Portfolio
  • Markets
        • US MARKET
          • Commodities
          • Energy
          • Precious Metals
          • Volatility
        • GLOBAL MARKETS
          • Market Indices
          • Economic Calendar
          • FOREX Heat Map
          • FOREX Cross Rates
          • Crypto Currency Market
  • Investing
    • Discord Community
    • Dashboard
  • Resources
        • INVESTING GUIDES
          • Dividend Growth Guide
          • Investment Strategy Framework
          • ETF Investing Handbook
          • Stock Trading Handbook
        • ARTICLES
          • Dividend Growth Model Articles
          • ETF Articles
          • Investment Strategies Articles
          • Market and Economic Insights
          • Stock Trade Articles
          • Stock Reviews
        • TOOLS
          • Stock Scanners
          • Charting Software
          • Brokerage Firms
          • Stocks We Review
        • STOCK CHARTS
          • Key Components
          • Reading Charts
          • Drawing Stock Charts
          • Identifying Trends
  • About
    • Contact Us
    • How to Win
    • #1 At Stockcharts
    • Disclaimer
    • FAQ
  • Log In
  • Subscribe

Buy / Sell Signals

March 16, 2017

Money Wave Alert! Mar 16, 2017

SPX Chart

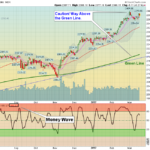
  The Markets  are down slightly today, as the S&P 500 struggles back up to re-test the 2401 Highs... Failing to make new highs should cause selling. The rally we were expecting has not been very powerful, and without … [Read more...]

March 15, 2017

Money Wave Alert! Mar 15, 2017

VALE Chart

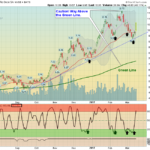
  The Markets  are up today, as Crude Oil finally bounced, and the US Dollar dropped.  The Indices have been holding up very well, which means that Tammy still has some Money to spend. The DOW wants to try the Highs again. The FED RAISED … [Read more...]

March 14, 2017

Money Wave Alert! Mar 14, 2017

Bond Chart

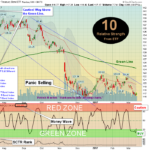
  The Markets  are down today, as Crude Oil "Gapped Down" on Inventory news.  The Indices have been holding up very well, even with Crude Oil dropping below $48. Looks like the DOW wants to try the Highs again. Many are waiting on probable … [Read more...]

March 13, 2017

Money Wave Alert! Mar 13, 2017

VALE Chart

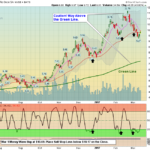
  The Markets  are mixed up today, but there will be more Buy Signals today as many Leaders come out of the Green Zones. The Indices have been holding up very well, even with Crude Oil dropping below $49. Looks like the DOW wants to try the … [Read more...]

March 10, 2017

Money Wave Alert! Mar 10, 2017

DOW Chart

  The Markets  popped up today, as many Leaders were in the Green Zones, and the Watch List was loaded. The Indices have been holding up very well, even with Crude Oil dropping below $49. Looks like the DOW wants to try the Highs … [Read more...]

  • « Previous Page
  • 1
  • …
  • 467
  • 468
  • 469
  • 470
  • 471
  • …
  • 497
  • Next Page »
FREE TRADE PICK

Get This Week's
Top Pick — Free

One rules-based swing trade signal. No credit card. No obligation.

  • Buy price, target & exit rules included
  • Based on relative strength & trend signals
  • Recent picks: +17.1%, +10.7%, +6.2%

This week's Top Pick drops Sunday afternoon

Enter your email to get it delivered to your inbox

SEND MY FREE PICK

We don't spam! Read our privacy policy for more info.

Subscribe to Our Newsletter

AGL Logo

Get our eBook Now!

Candlestick - A Swing Traders Friend

We don’t spam! Read our privacy policy for more info.

You’ve been successfully subscribed to our newsletter!

Voted #1 at Stock Charts

SH Chart
Inverse S&P 500 Fund (SH) will have a Money Wave Buy today.

Help Us Help Animals

Help Us Help Animals

Recent Comments

  • ATGL Weekly Money Flow - 2026-03-08 on ATGL Top Pick of the Week! Feb 22, 2026
  • XBI ETF Explained: Is This Biotech Fund a Smart Buy in 2026? on What Is an Expense Ratio and What Would Be a Good One?
  • XBI ETF Explained: Is This Biotech Fund a Smart Buy in 2026? on What Are Sector ETFs and How Do You Invest in Them?
  • XBI ETF Explained: Is This Biotech Fund a Smart Buy in 2026? on ETF vs Index Fund Comparison Guide for Smarter Investing
  • How to Use Net Present Value (NPV) for Dividend Stocks on How To Analyze Stocks With the Dividend Discount Model

Become a Green Liner!

Help me make more Money in the Stock Market.

ON ATGL

  • DashBoard
  • Weekly Commentary
  • Daily Buy / Sell Signals
  • Day Trade Setup
  • Trading Rooms

Design & Develop By Pixelvect

STRATEGIES

  • Swing Trading
  • ATGL Pick of the Week
  • Dividend Growth
  • ETF Sector Rotation
  • Dogs of the Dow

HELP

  • ATGL Trading Rules
  • FAQ
  • Account Maintenance
  • Contact US
  • Join

FOLLOW US

Instagram Linkedin Twitter Facebook

© COPYRIGHT 2024 · ABOVETHEGREENLINE.COM · ALL RIGHTS RESERVED · PRIVACY · TERMS · CONTACT · WATCHLIST · CURRENT