
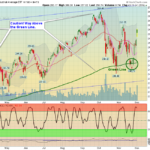
Markets "Gapped Up" on Good News today, so expect some profit taking soon as Smart Money sells on the Good News. Remember, Smart Money bought on Bad News BEFORE the FED talk last Wednesday, and BEFORE the Trade News today. The rally … [Read more...]
Money Wave Alert! Dec 3, 2018
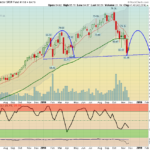
Money Wave Alert! Nov 30, 2018
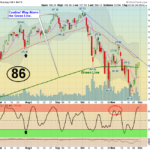
Markets were up again today on lower Volume. Markets are finishing up for the week with a nice bounce of a possible "W" pattern back up. The rally is getting over-bought on the Short Term. Please check the Sell Stops in the PORTFOLIO … [Read more...]
Money Wave Alert! Nov 29, 2018
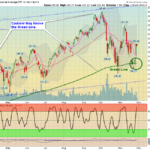
Markets were up slightly today after dipping lower in the morning. Looks like a "W" pattern back up, but the rally is getting over-bought on the Short Term. Please check the Sell Stops in the PORTFOLIO as many have been tightened … [Read more...]
Money Wave Alert! Nov 28, 2018
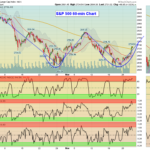
Markets popped up big today as the FED made positive talks to make the HERD feel better. Looks like many are now betting on a Double Bottom soon, and we could see a "W" pattern for a much larger rally up longer term. Try to own only … [Read more...]
Money Wave Alert! Nov 27, 2018
Markets were up slightly today after some Selling this morning. The Pink Line (10-day avg.) could be resistance for the Indexes for a while. Many are waiting to see if the Indices are going to Hold and Bounce at the Support of the … [Read more...]
- « Previous Page
- 1
- …
- 375
- 376
- 377
- 378
- 379
- …
- 492
- Next Page »