
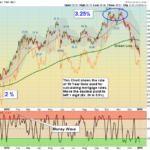
Markets were slightly lower on average Volume as the Markets rest from the bounce off the Lows. The S&P 500 was above to Close above the Pink Line Resistance (10-day avg.) at 2477. We are reluctant to buy more at this level as the … [Read more...]
Money Wave Alert! Jan 2, 2019
Money Wave Alert! Dec 31, 2018
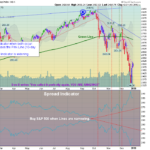
Markets were higher again today with low Volume as the S&P 500 tries to Close above the Pink Line Resistance (10-day avg.) at 2477. We are reluctant to buy more at this level as the Markets could go back down once more. The Inverse … [Read more...]
Money Wave Alert! Dec 28, 2018
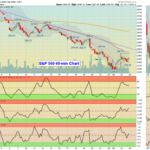
Markets were up slightly again today as the S&P 500 tries to Close above the Pink Line Resistance (10-day avg.) at 2488. The Markets have had a decent bounce off the Lows this week, as they were extremely Over-Sold and should return … [Read more...]
Money Wave Alert! Dec 27, 2018
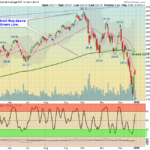
Markets corrected some of yesterday's Big rally by dipping back down about 1/2 way down. The next Resistance on the S&P 500 is the Pink Line (10-day avg.) at 2499. The Markets are extremely Over-Sold and should back up towards the … [Read more...]
Money Wave Alert! Dec 26, 2018
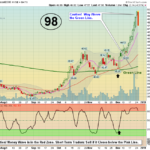
Markets finally bounced up today on Low Volume, as the Markets were extremely Over-Sold. The Indices were stretched Way Below the Green Lines like a rubber band, and should snap back up towards the Green Line once Tammy Sells out on … [Read more...]
- « Previous Page
- 1
- …
- 371
- 372
- 373
- 374
- 375
- …
- 492
- Next Page »