Above The Green Line

  • Commentary
    • BUY / SELL SIGNALS
      • Stock Alerts
    • DIVGRO BLOG
    • ETF SECTOR BLOG
    • DOW DOGS BLOG
    • NEWS
    • STOCK IDEAS
  • Strategies
    • SWING TRADING
      • CURRENT POSITIONS
      • WATCHLISTS
      • CLOSED POSITIONS
      • CANDIDATES – TOP 100
      • SPECIALTY STOCKS
    • DAY TRADING
      • Watch List
    • DIVIDEND GROWTH
      • Dividend Growth Portfolio
      • Dividend Calendar
    • DOGS OF THE DOW
      • Dogs of the Dow Portfolio
      • DOW 5 Portfolio
    • ETF SECTOR ROTATION
      • ETF Sector Portfolio
  • Markets
    • US MARKET
      • Commodities
      • Energy
      • Precious Metals
      • Volatility
    • GLOBAL MARKETS
      • MARKET INDICES
      • ECONOMIC CALENDAR
      • FOREX HEAT MAP
      • FOREX CROSS RATES
      • CRYPTOCURRENCY MARKET
    • DASHBOARD
    • IDEAS
  • Investing
    • FORUM
  • Resources
    • ARTICLES
    • WEEKLY STOCK
    • RETIREMENT PLANNING
    • BLOGROLL
    • FAQ
  • About
    • CONTACT US
    • HOW TO WIN
    • #1 AT STOCKCHARTS
  • Log In
  • Subscribe

December 31, 2018

Money Wave Alert! Dec 31, 2018

SPX Chart
The S&P 500 needs to Close above the Pink Line of 2477.


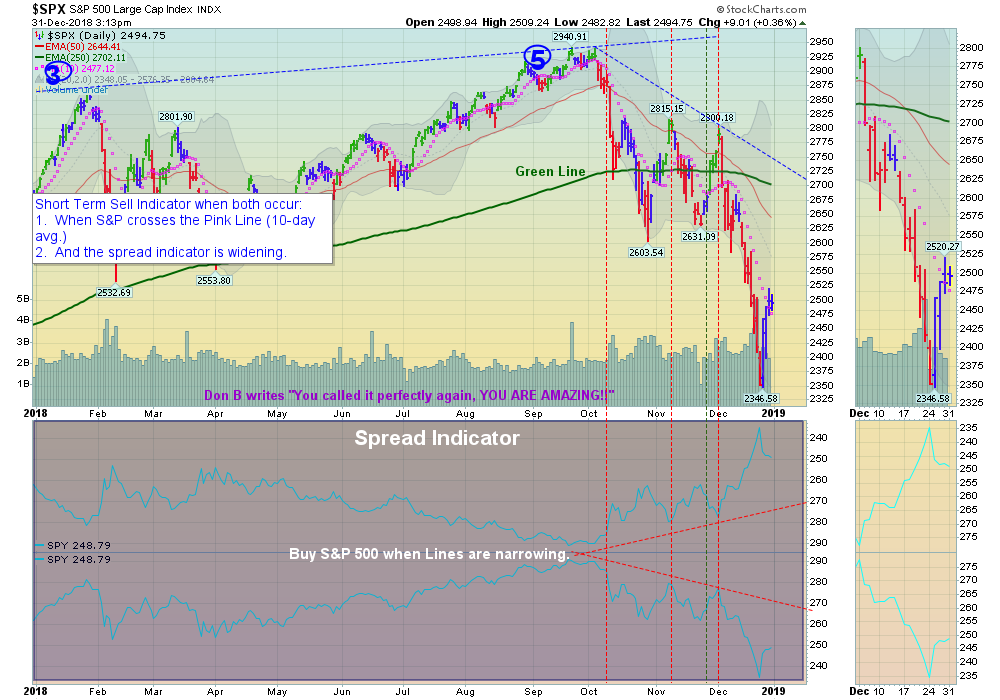
Markets  were higher again today with low Volume as the S&P 500 tries to Close above the Pink Line Resistance (10-day avg.) at 2477.

We are reluctant to buy more at this level as the Markets could go back down once more. The Inverse Funds (see Watch List below) are back down in the Green Zones for a Money Wave Buy soon.

Longer term the Markets are extremely Over-Sold and should return back up towards the Green Line after backing and filling.

Crude Oil  was up $0.30 today at  $45.75. 

____________________________________________________________________________________________________

The Following Investments will probably have a Money Wave Buy Signal soon.
(Slow Stochastic Closing > 20) on today’s Close.


BUYS TODAY    NONE TODAY


Money Wave Buys Signals Soon:   

PSQ    INVERSE NASDAQ 100 FUND   

RWM    INVERSE SMALL CAP FUND    Money Wave must Close in the Green Zone.

SH    INVERSE S&P 500 FUND   

TLT    US GOV’T. BOND FUND

NIHD    NII HOLDINGS    Place Buy Stop Order above $4.49.
XLU   UTILITIES FUND    Medium Term. Wait for Close Above the Pink Line
     

Please be patient and wait for Money Wave Buy Signals.  We will email you when they are ready. Click on Watch List.

Emotions are very high now, so please do not Buy unless you are VERY NIMBLE. The Leaders are still Way Above the Green Lines (all Investments eventually return to their Green Lines).

______________________________________________________________________________________

SELLS TODAY   


EXIT    CROX    CROCS, INC.    if it is going to Close below your Buy Price, or $25.97.

EXIT    ETSY     ETSY INC.    if it is going to Close below your Buy Price, or $47.21.

LOWER the Sell Stop Loss on    UNG    US NATURAL GAS FUND    to $24.00 until it bottoms. The Relative Strength is still 94 from ETFScreen.com, and UNG is back down in the Green Zone.


Please Check   PORTFOLIO  (Open Positions) and adjust your Sell Stops.

Click for  CLOSED POSITIONS.


Many like to Buy the day before, near the Close, if the Money Wave is going to create a Buy Signal (Closing > 20).

Don’t Buy if the Investment has already popped up too much. Money Wave Buys are usually good for a 3-6 %  move in a few days. We will “Not Log” trades if the Reward/Risk is not at least 2:1.


HAPPY NEW YEAR!

Posted By AbovetheGreenLine at 2:36 pm 2 Comments Tagged With: premium

Comments

  1. Windwoodtrader says

    December 31, 2018 at 4:32 pm

    I tried to find a setting to illustrate the “Spread Indicator” as discussed in the comments today.

    Neither I nor Stock Charts.com could come up with a good reference point.
    Can you advise, please?

    Log in to Reply
    • AbovetheGreenLine says

      December 31, 2018 at 5:47 pm

      The Spread Indicator is simply a visual, of the Chart –SPY on top of SPY, and add Color Box.
      Click on “Chart Settings” on the right.
      Go down to “Indicators” drop down menu… Select Price, then Parameter is -SPY.
      Below that: Go down to “Indicators” drop down menu… Select Price, then Parameter is SPY.

      Fill in Box with a color.

      Good trading, and tell your friends!

      Log in to Reply

Leave a Reply Cancel reply

You must be logged in to post a comment.

Voted #1 at Stock Charts

SH Chart
Inverse S&P 500 Fund (SH) will have a Money Wave Buy today.

Help Us Help Animals

Help Us Help Animals

Recent Comments

  • AbovetheGreenLine on Target was Hit on IVERIC Bio for a 13.4% Gain.
  • Gustavo Covacevich on Target was Hit on IVERIC Bio for a 13.4% Gain.
  • AbovetheGreenLine on Money Wave Alert! Jan 31, 2023
  • tri nguyen on Money Wave Alert! Jan 31, 2023
  • AbovetheGreenLine on Money Wave Alert! Jan 17, 2023

Become a Green Liner!

Help me make more Money in the Stock Market.

Above the Green Line

ON ATGL

  • Weekly Commentary
  • Intraday Buy / Sells
  • Day Trade Setup

STRATEGIES

  • Swing Trading
  • Dividend Growth
  • ETF Sector Rotation
  • Dogs of the Dow

HELP

  • ATGL Trading Rules
  • FAQ
  • Account Maintenance
  • Contact US

© Copyright 2021 · AboveTheGreenLine.com · All Rights Reserved · Privacy · Terms · Contact · WatchList · Current