
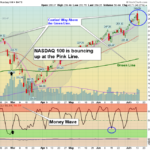
Markets were up today after the Large Cap Techs and Leaders got hit pretty hard with Selling yesterday. The Strongest Investments are bouncing at their Pink Lines (10-day avgs.) to avoid a Short Term Sell Signal. There is still some late chaser money … [Read more...]
Money Wave Alert! Jul 14, 2020
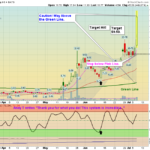
Money Wave Alert! Jul 13, 2020
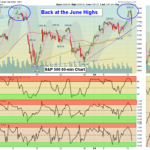
Markets were mixed today after the Large Cap Techs continued to blow out in the morning. The Strongest Leaders are very extended for the Short Term. The S&P 500 Index made it up to the early June Highs of 3233, and then back off. The S&P 500 … [Read more...]
Money Wave Alert! Jul 10, 2020
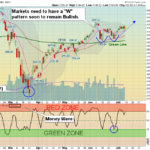
Markets were up today after yesterday's decline. Some of the Large Cap Techs had some mild profit taking. The Strongest Leaders are very extended for the Short Term. The S&P 500 Index needs to exceed the early June Highs of 3233 for this rally … [Read more...]
Money Wave Alert! Jul 9, 2020
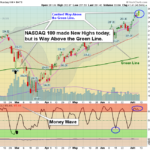
Markets were mixed today, but the Large Cap Tech stretched higher. The Strongest Leaders are very extended for the Short Term. The NASDAQ 100 Fund and Semiconductors were able to make New Highs today with the weak US Dollar. The S&P 500 Index … [Read more...]
Money Wave Alert! Jul 8, 2020
Markets were up slightly today after yesterday's drop. The Large Cap Leader are very extended for the Short Term. The NASDAQ 100 Fund and the very largest Leaders are still on New Highs. The S&P 500 Index needs to exceed the early June Highs of … [Read more...]
- « Previous Page
- 1
- …
- 293
- 294
- 295
- 296
- 297
- …
- 491
- Next Page »