Above the Green Line -01
  • Market Insights
        • Commentary
          • Daily
          • Weekly
        • BUY / SELL SIGNALS
          • Trade Posts
          • Recent Trade Alerts
          • Recent Day Trades
        • BLOGROLL
          • Dividend Growth Blog
          • ETF Sector Blog
          • Dow Dogs
          • TPOW Blog
  • Strategies
        • SWING TRADING
          • Current Positions
          • Watchlists
          • Closed Positions
          • Candidates - TOP 100
          • Specialty Stocks
        • WEEKLY STOCK PICK
          • TPOW Charts
          • TPOW Performance
          • TPOW Strategy Guide
          • TPOW Performance Dashboard
          • Why Weekly Trading Works
        • DAY TRADING
          • Watch List
        • ATGL DASHBOARD
        • ETF STRATEGIES
          • ETF Sector Rotation
          • ETF Sector Portfolio
        • DIVIDEND GROWTH
          • Dividend Growth Portfolio
          • Dividend Calendar
        • DOGS OF THE DOW
          • Dogs of the Dow Portfolio
          • DOW 5 Portfolio
  • Markets
        • US MARKET
          • Commodities
          • Energy
          • Precious Metals
          • Volatility
        • GLOBAL MARKETS
          • Market Indices
          • Economic Calendar
          • FOREX Heat Map
          • FOREX Cross Rates
          • Crypto Currency Market
  • Investing
    • Discord Community
    • Dashboard
  • Resources
        • INVESTING GUIDES
          • Dividend Growth Guide
          • Investment Strategy Framework
          • ETF Investing Handbook
          • Stock Trading Handbook
        • ARTICLES
          • Dividend Growth Model Articles
          • ETF Articles
          • Investment Strategies Articles
          • Market and Economic Insights
          • Stock Trade Articles
          • Stock Reviews
        • TOOLS
          • Stock Scanners
          • Charting Software
          • Brokerage Firms
          • Stocks We Review
        • STOCK CHARTS
          • Key Components
          • Reading Charts
          • Drawing Stock Charts
          • Identifying Trends
  • About
    • Contact Us
    • How to Win
    • #1 At Stockcharts
    • Disclaimer
    • FAQ
  • Log In
  • Subscribe

Buy / Sell Signals

May 12, 2021

Money Wave Alert! May 12, 2021

SPY Chart

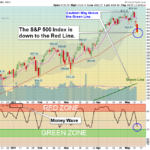
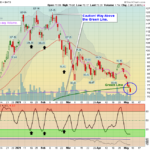
Markets were lower again today, as the DOW 30 Index and the S&P 500 are finally correcting down to their Red Lines (50-day avgs.) Now Investors are a little scared (FEAR), which is when we like to Buy soon. The DOW 30 is the strongest Index, and … [Read more...]

May 11, 2021

Money Wave Alert! May 11, 2021

AFMD Chart

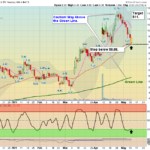
Markets were lower again today, as the broader markets got hit. The DOW 30 Index and the S&P 500 are finally correcting down towards their Red Lines (50-day avgs.) There were several Reversals today on the Momentum Stocks are they should be ready … [Read more...]

May 10, 2021

Money Wave Alert! May 10, 2021

SMH Chart

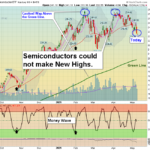
Markets were mostly lower today, as the weaker Tech Stocks got hit. The DOW 30 Index and the S&P 500 are too over bought to go much higher without a pullback. Trading would be better if these Indices could pull back down to the Red Lines (50-day … [Read more...]

May 7, 2021

Money Wave Alert! May 7, 2021

XLE Chart

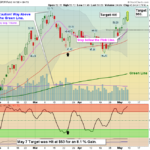
Markets were higher again today, as many Momentum Stocks finally popped up. The DOW 30 Index and the S&P 500 are back on the Highs, with the other Indices laggings. Volume is low as a warning not to Buy Way Above the Green Lines. Industrial … [Read more...]

May 6, 2021

Money Wave Alert! May 6, 2021

TAN Chart

Markets were mostly higher today, but the Solar and Momentum Stocks continued to flush Tammy out after 30 -50 % Corrections from the recent Highs. Many Momentum stocks should be able to pop up again as long as the 50-day averages do not fall below … [Read more...]

  • « Previous Page
  • 1
  • …
  • 257
  • 258
  • 259
  • 260
  • 261
  • …
  • 497
  • Next Page »
FREE TRADE PICK

Get This Week's
Top Pick — Free

One rules-based swing trade signal. No credit card. No obligation.

  • Buy price, target & exit rules included
  • Based on relative strength & trend signals
  • Recent picks: +17.1%, +10.7%, +6.2%

This week's Top Pick drops Sunday afternoon

Enter your email to get it delivered to your inbox

SEND MY FREE PICK

We don't spam! Read our privacy policy for more info.

Subscribe to Our Newsletter

AGL Logo

Get our eBook Now!

Candlestick - A Swing Traders Friend

We don’t spam! Read our privacy policy for more info.

You’ve been successfully subscribed to our newsletter!

Voted #1 at Stock Charts

SH Chart
Inverse S&P 500 Fund (SH) will have a Money Wave Buy today.

Help Us Help Animals

Help Us Help Animals

Recent Comments

  • ATGL Weekly Money Flow - 2026-03-08 on ATGL Top Pick of the Week! Feb 22, 2026
  • XBI ETF Explained: Is This Biotech Fund a Smart Buy in 2026? on What Is an Expense Ratio and What Would Be a Good One?
  • XBI ETF Explained: Is This Biotech Fund a Smart Buy in 2026? on What Are Sector ETFs and How Do You Invest in Them?
  • XBI ETF Explained: Is This Biotech Fund a Smart Buy in 2026? on ETF vs Index Fund Comparison Guide for Smarter Investing
  • How to Use Net Present Value (NPV) for Dividend Stocks on How To Analyze Stocks With the Dividend Discount Model

Become a Green Liner!

Help me make more Money in the Stock Market.

ON ATGL

  • DashBoard
  • Weekly Commentary
  • Daily Buy / Sell Signals
  • Day Trade Setup
  • Trading Rooms

Design & Develop By Pixelvect

STRATEGIES

  • Swing Trading
  • ATGL Pick of the Week
  • Dividend Growth
  • ETF Sector Rotation
  • Dogs of the Dow

HELP

  • ATGL Trading Rules
  • FAQ
  • Account Maintenance
  • Contact US
  • Join

FOLLOW US

Instagram Linkedin Twitter Facebook

© COPYRIGHT 2024 · ABOVETHEGREENLINE.COM · ALL RIGHTS RESERVED · PRIVACY · TERMS · CONTACT · WATCHLIST · CURRENT