
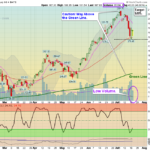
Markets were higher again today as the Indices try to retest the recent Highs. Volume was low on most, but there were more Money Wave Buy Signals today. Some Buy Signals have already popped up too much to safely Buy on the Close. We are concerned … [Read more...]
Money Wave Alert! Jul 21, 2021
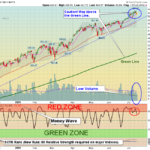
Money Wave Alert! Jul 20, 2021
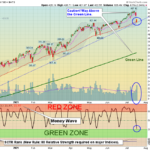
Markets were sharply higher today as the Virus Fears from yesterday must be gone now. The S&P 500 Index bounced up off the Red Line (50-day average) as expected, but the Buying Volume is still below average. Low Volume says Smart Money is not … [Read more...]
Money Wave Alert! Jul 19, 2021
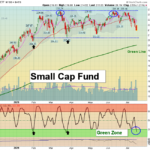
Markets were sharply lower today as the Media has convinced Investors to worry about the Virus again. Dozens of Leaders are back down in the Green Zones, so we are focusing mainly on the ones that can hold above the Red Lines (50-day averages) with … [Read more...]
Money Wave Alert! Jul 16, 2021
Markets were lower again today as yesterday's bounce up off the Pink Lines (10-day avgs.) was weak and more Selling came in. This created a Short Term Sell Signal. Many stocks were down today, but the Selling was not heavy Many Leaders are quickly … [Read more...]
Money Wave Alert! Jul 15, 2021
Markets were mostly lower today as the Indices went down to the Pink Lines (10-day avgs.) and bounced. Closing below the Pink Lines would normally create a Short Term Sell Signal. Many stocks were down today. More talk about when the FED will … [Read more...]
- « Previous Page
- 1
- …
- 249
- 250
- 251
- 252
- 253
- …
- 499
- Next Page »