
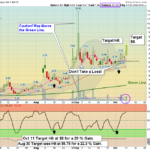
Markets were slightly lower today as the S&P 500 Index could not Close above the Red Line (50-day avg.) of 4402 and profit taking came it. Volume was very Low on most Investments today, so many was just watching and waiting. The S&P 500 … [Read more...]
Money Wave Alert! Oct 11, 2021
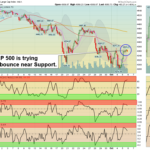
Money Wave Alert! Oct 8, 2021
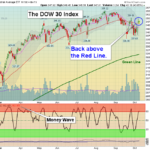
Markets were slightly higher today but the S&P 500 Index is still struggling to Close above the Red Line (50-day avg.) of 4403. The S&P 500 Index might have finished with an A-B-C Correction. Then the S&P 500 could go back up to re-test … [Read more...]
Money Wave Alert! Oct 7, 2021
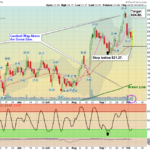
Markets were higher today as the S&P 500 Index is trying to get back above the Red Line (50-day avg.) of 4404. The S&P 500 Index and could have finished with an A-B-C Correction. Then the S&P 500 could go back up to re-test the … [Read more...]
Money Wave Alert! Oct 6, 2021
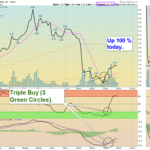
Markets were down this morning and recovered near the Close. Volume was higher as more Buying came into the over-sold Indices again this morning. The S&P 500 Index is about half way down to the Green Line, and could be about finished with an … [Read more...]
Money Wave Alert! Oct 5, 2021
Markets were sharply higher today as Buying came in from over-sold Indices. The Big Tech Stocks finally bounced, but the Volume was still low on most. The S&P 500 Index is about half way down to the Green Line, and could be about finished with an … [Read more...]
- « Previous Page
- 1
- …
- 228
- 229
- 230
- 231
- 232
- …
- 489
- Next Page »