Above the Green Line -01
  • Market Insights
        • Commentary
          • Daily
          • Weekly
        • BUY / SELL SIGNALS
          • Trade Posts
          • Recent Trade Alerts
          • Recent Day Trades
        • BLOGROLL
          • Dividend Growth Blog
          • ETF Sector Blog
          • Dow Dogs
          • TPOW Blog
  • Strategies
        • SWING TRADING
          • Current Positions
          • Watchlists
          • Closed Positions
          • Candidates - TOP 100
          • Specialty Stocks
        • WEEKLY STOCK PICK
          • TPOW Charts
          • TPOW Performance
          • TPOW Strategy Guide
          • TPOW Performance Dashboard
        • DAY TRADING
          • Watch List
        • ATGL DASHBOARD
        • ETF STRATEGIES
          • ETF Sector Rotation
          • ETF Sector Portfolio
        • DIVIDEND GROWTH
          • Dividend Growth Portfolio
          • Dividend Calendar
        • DOGS OF THE DOW
          • Dogs of the Dow Portfolio
          • DOW 5 Portfolio
  • Markets
        • US MARKET
          • Commodities
          • Energy
          • Precious Metals
          • Volatility
        • GLOBAL MARKETS
          • Market Indices
          • Economic Calendar
          • FOREX Heat Map
          • FOREX Cross Rates
          • Crypto Currency Market
  • Investing
    • Discord Community
    • Dashboard
  • Resources
        • ARTICLES
          • Dividend Growth Model Articles
          • ETF Articles
          • Investment Strategies Articles
          • Market and Economic Insights
          • Stock Trade Articles
          • Stock Reviews
        • TOOLS
          • Stock Scanners
          • Charting Software
          • Brokerage Firms
        • STOCK CHARTS
          • Key Components
          • Reading Charts
          • Drawing Stock Charts
          • Identifying Trends
        • RETIREMENT PLANNING
  • About
    • Contact Us
    • How to Win
    • #1 At Stockcharts
    • Disclaimer
    • FAQ
  • Log In
  • Subscribe

October 8, 2021

Money Wave Alert! Oct 8, 2021

DIA Chart
The DOW 30 Index is back above the Red Line (50-day avg.)

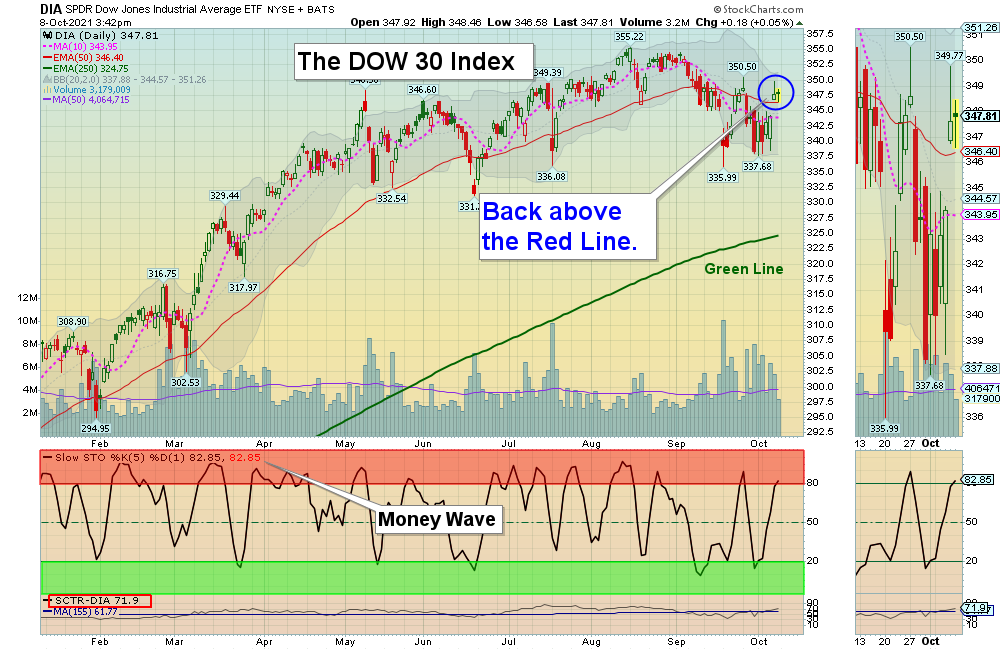
Markets were slightly higher today but the S&P 500 Index is still struggling to Close above the Red Line (50-day avg.) of 4403. The S&P 500 Index might  have  finished with an A-B-C Correction. Then the S&P 500 could go back up to re-test the Highs. Several Leaders are quickly back up in the Red Zones (probably too late to Buy for the Short Term).

Try to only Buy new money investments that held above the Red Lines, as they tend to bounce first. 

New Investors:  Leaders have had some Money Wave Pops. But we normally need good Volume for the bounce to last more than one day. Most pops have been on below average Volume. The better trades happen when the S&P 500 Index is in the Green Zone.  

Triple Buys today for AFRM (+7%) & LIFE  (+11%). Soon for AMC ANY BBIG BTU CRVS MRIN & IRNT in DAY TRADING SETUPS. 

Bonds  were down again today, and are back Below the Green Line.

Crude Oil was up $1.27 today at $79.57.

BUYS TODAY    10/8/2021   

LIFE      ATRY PHARMA INC.       Popped up above above $8.82 for a 10 % Gain, but the Volume was not High. LIFE will not be Bought or Logged. Maybe you got some on the Triple Buy Signal earlier today.

We will “Not Log” trades if the Reward/Risk is not at least 2:1, or Low Volume. These have more risk.   

_________________________________________________________________________________________________

JUMP START SCROLLING CHARTS: (Buy Signal should be very soon… Click on the Jump Start link for more info.)      

AMC      AMC ENTERTAINMENT    Buy above the Pink Line around $37.49 with High Volume with a 5% Trailing Sell Stop Loss below it.   

BBIG      VINCO VENTURES INC.      Wait for Money Wave Close > 20 with High Volume. (2nd Buy Signal soon).

DKS      DICKS SPORTING GOODS       Buy above $122.02 with High Volume with a 5% Trailing Sell Stop Loss below it.

_________________________________________________________________________________________________

WATCH LIST (Click here)       

WATCH LIST SCROLLING CHARTS (Real Time)

AA      ALCOA CORP.       Wait for Money Wave Close > 20 with High Volume.

MRIN      MARIN SOFTWARE INC.     Buy above the $8.60 with High Volume with a 5% Trailing Sell Stop Loss below it.

Please be patient and wait for Money Wave Buy Signals.  We will email you when they are ready. Follow on the WATCH LIST.      
Emotions are very high now, so please do not Buy unless you are VERY NIMBLE.

The Leaders are Way Above the Green Lines (all Investments eventually return to their Green Lines).      

____________________________________________________________________________________________________________

SELLS TODAY          

F      FORD MOTOR CO.      Target was finally Hit at $15 for a 3.6 % Gain today.     

UNG      US NATURAL GAS FUND      EXIT if it is going to Close below the Pink Line around $19.99. The Target was already Hit for an 8.8% Gain.

Click for  CURRENT POSITION SCROLLING CHARTS – Real Time  (Please check and adjust your Sell Stops).     

Click for  CLOSED POSITIONS,   
NEW:       MY TRADING DASHBOARD
DAY TRADING SETUPS
NEW:  TRADE ALERTS
ARE YOUR INVESTMENTS ABOVE THE GREEN LINE?
ETF SECTOR ROTATION SYSTEM   
New TOP 100 LIST Updated Oct 1, 2021

Many like to Buy the day before, near the Close, if the Money Wave is going to create a Buy Signal (Closing > 20 and out of the Green Zone).

Don’t Buy if the Investment has already popped up too much. Money Wave Buys are usually good for a 3-6 %  move in a few days.

We will “Not Log” trades if the Reward/Risk is not at least 2:1, or Low Volume. These have more risk.   


HAVE A NICE WEEKEND!

Related Post

– Money Wave Alert! Oct 7, 2021

Subscribe to Our Newsletter

AGL Logo

Get our eBook Now!

Candlestick - A Swing Traders Friend

We don’t spam! Read our privacy policy for more info.

You’ve been successfully subscribed to our newsletter!

Voted #1 at Stock Charts

SH Chart
Inverse S&P 500 Fund (SH) will have a Money Wave Buy today.

Help Us Help Animals

Help Us Help Animals

Recent Comments

  • Market Breadth Indicators: A Trader’s Guide to Early Trend Detection on Backtesting: Definition and How a Trading Strategy Backtest Works
  • Island Reversal Pattern: Definition and Formation Explained on Double Top Pattern: How to Identify and Trade This Reversal Signal
  • Channel Pattern Guide: What It Is and Why It Matters on A Guide to Forecasting Using Moving Averages
  • What Is a Broadening Bottom Chart Pattern? Full Guide on Bull vs. Bear Market: An Investor’s Guide to Market Phases
  • ATGL Weekly Money Flow - 2025-05-11 on ATGL Top Pick of the Week! Apr 6, 2025

Become a Green Liner!

Help me make more Money in the Stock Market.

ON ATGL

  • DashBoard
  • Weekly Commentary
  • Daily Buy / Sell Signals
  • Day Trade Setup
  • Trading Rooms

Design & Develop By Pixelvect

STRATEGIES

  • Swing Trading
  • ATGL Pick of the Week
  • Dividend Growth
  • ETF Sector Rotation
  • Dogs of the Dow

HELP

  • ATGL Trading Rules
  • FAQ
  • Account Maintenance
  • Contact US
  • Join

FOLLOW US

Instagram Linkedin Twitter Facebook

© COPYRIGHT 2024 · ABOVETHEGREENLINE.COM · ALL RIGHTS RESERVED · PRIVACY · TERMS · CONTACT · WATCHLIST · CURRENT