
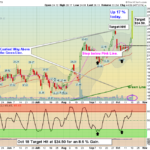
Markets were mostly higher today as the Indices are going back up to retest the recent Highs. Same Market as Friday. Now the Indices must continue to make Higher Highs for the rally that began in March 2020 to continue. Volume is Low and many of the … [Read more...]
Money Wave Alert! Oct 18, 2021
Money Wave Alert! Oct 15, 2021
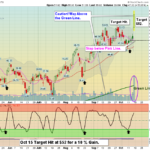
Markets were higher today as the Indices are going back up to retest the recent Highs. Now the Indices must continue to make Higher Highs for the rally that began in March 2020 to continue. Volume is Low and many of the Leaders are back up in the Red … [Read more...]
Money Wave Alert! Oct 14, 2021
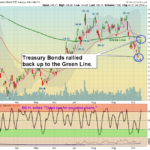
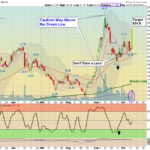
Markets were sharply higher today as the Treasury Bonds have rallied almost back up to the Green Line (see Chart above). That means lower Interest Rates for the Long Term, so the S&P 500 Index was able to Close back above the Red Line (50-day … [Read more...]
Money Wave Alert! Oct 13, 2021
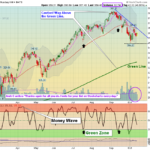
Markets were slightly higher today but the S&P 500 Index still needs to Close back above the Red Line (50-day avg.) of 4400 to bring in the Traders back in. The S&P 500 should be able to go back up to re-test the Highs, but we are waiting for … [Read more...]
Money Wave Alert! Oct 12, 2021
Markets were slightly lower today as the S&P 500 Index needs to Close back above the Red Line (50-day avg.) of 4400 to bring in the Traders back in. The S&P 500 should be able to go back up to re-test the Highs, but many Leaders need to come … [Read more...]
- « Previous Page
- 1
- …
- 227
- 228
- 229
- 230
- 231
- …
- 489
- Next Page »