
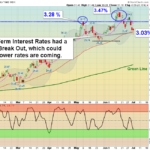
MARKETS WILL BE CLOSED ON MONDAY FOR JULY 4TH HOLIDAY. Markets were higher today on lower pre-holiday Buying. Some of the Indices are trying to get back above the the Pink Lines (10-day avgs.). The Markets need to put in a Higher Low soon to show … [Read more...]
Money Wave Alert! Jul 1, 2022
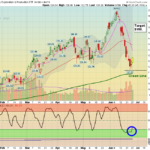
Money Wave Alert! Jun 30, 2022
Markets gapped down below the Pink Lines (10-day avgs.) on the opening. Then the Markets rallied up near the Pink Lines and sold off again. The Markets need to put in a Higher Low soon to show any sign of bottoming. Semiconductors are still weak. The … [Read more...]
Money Wave Alert! Jun 29, 2022
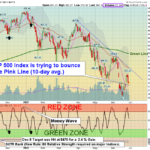
Markets were mixed again today as the Indices are trying to bounce up at the Pink Line (10-day avgs.). That could be Bullish if the Markets can put in a Higher Low soon. Semiconductors are still weak. The major Indices are all Below the Green Lines … [Read more...]
Money Wave Alert! Jun 28, 2022
Markets were lower again today as the Indices were back up in the Red Zones (probably too late to Buy for the Short Term). Now the Indices need to NOT make a new lows to indicate that the Selling could be over for a while. The major Indices are all … [Read more...]
Money Wave Alert! Jun 27, 2022
Markets were mostly lower today as the Indices drifted on very low Volume. There was very little Buying, as the major Indices are above the Pink Lines (10-day avgs.), and the next Resistance is the Red Lines (50-day avgs.). The Strongest Leaders … [Read more...]
- « Previous Page
- 1
- …
- 192
- 193
- 194
- 195
- 196
- …
- 491
- Next Page »