
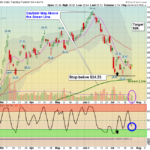
Markets were slightly lower today as the Tech and Semiconductors had normal profit taking and Volume was very low. Now the Red Lines (50-day avgs.) need to become Support for the Indices to have further Market rallies. Semiconductors are hoping for … [Read more...]
Money Wave Alert! Jul 25, 2022
Money Wave Alert! Jul 22, 2022
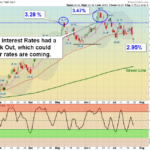
Markets were lower today on normal profit taking, as the Semiconductors & Big Techs had big moves up this week. Now the Red Lines (50-day avgs.) need to become Support for the Indices to have further Market rallies. Semiconductors are hoping for … [Read more...]
Money Wave Alert! Jul 21, 2022
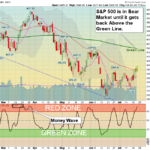
Markets were higher again today, as the Semiconductors & Big Techs led the way on Short Covering. The Indices are finally above the Red Lines (50-day avgs.) which need to become Support for further Market rallies. Semiconductors are hoping for … [Read more...]
Money Wave Alert! Jul 20, 2022
Markets were higher again today, as the Indices are finally Closing above the Red Lines (50-day avgs.) which has been Resistance since May. FEAR has quickly disappeared now as the Indices are creeping higher. Semiconductors are hoping for another … [Read more...]
Money Wave Alert! Jul 19, 2022
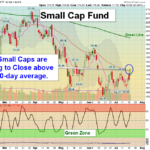
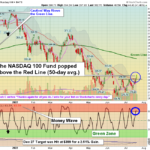
Markets were sharply higher today, as the Indices are trying again to Close above the Red Lines (50-day avgs.) which has been Resistance since May. The Small Caps, DOW 30 and NASDAQ 100 Funds are currently above the Red Lines today, but the Volume … [Read more...]
- « Previous Page
- 1
- …
- 188
- 189
- 190
- 191
- 192
- …
- 490
- Next Page »