Above the Green Line -01
  • Market Insights
        • Commentary
          • Daily
          • Weekly
        • BUY / SELL SIGNALS
          • Trade Posts
          • Recent Trade Alerts
          • Recent Day Trades
        • BLOGROLL
          • Dividend Growth Blog
          • ETF Sector Blog
          • Dow Dogs
          • TPOW Blog
  • Strategies
        • SWING TRADING
          • Current Positions
          • Watchlists
          • Closed Positions
          • Candidates - TOP 100
          • Specialty Stocks
        • WEEKLY STOCK PICK
          • TPOW Charts
          • TPOW Performance
          • TPOW Strategy Guide
          • TPOW Performance Dashboard
        • DAY TRADING
          • Watch List
        • ATGL DASHBOARD
        • ETF STRATEGIES
          • ETF Sector Rotation
          • ETF Sector Portfolio
        • DIVIDEND GROWTH
          • Dividend Growth Portfolio
          • Dividend Calendar
        • DOGS OF THE DOW
          • Dogs of the Dow Portfolio
          • DOW 5 Portfolio
  • Markets
        • US MARKET
          • Commodities
          • Energy
          • Precious Metals
          • Volatility
        • GLOBAL MARKETS
          • Market Indices
          • Economic Calendar
          • FOREX Heat Map
          • FOREX Cross Rates
          • Crypto Currency Market
  • Investing
    • Discord Community
    • Dashboard
  • Resources
        • ARTICLES
          • Dividend Growth Model Articles
          • ETF Articles
          • Investment Strategies Articles
          • Market and Economic Insights
          • Stock Trade Articles
          • Stock Reviews
        • TOOLS
          • Stock Scanners
          • Charting Software
          • Brokerage Firms
        • STOCK CHARTS
          • Key Components
          • Reading Charts
          • Drawing Stock Charts
          • Identifying Trends
        • RETIREMENT PLANNING
  • About
    • Contact Us
    • How to Win
    • #1 At Stockcharts
    • Disclaimer
    • FAQ
  • Log In
  • Subscribe

July 22, 2022

Money Wave Alert! Jul 22, 2022

TNX Chart
Long Term T-Bond Interest Rates have dropped from 3.47% to 2.95%.

Markets  were lower today on normal profit taking, as the Semiconductors & Big Techs had big moves up this week. Now the Red Lines (50-day avgs.) need to become Support for the Indices to have further Market rallies. Semiconductors are hoping for another $52 Billion of money from Congress. 

Many are hoping that the Markets have bottomed, but most investments are still Below the Green Lines (Bearish) and could have trouble getting back above the Green Lines until the FED starts Printing again. The next Resistance is the Green Lines for the Indices (above 4201 on the S&P 500 Index).  

Please be patient and wait for Buy Signals for Investments that are still Above the Green Lines.  BUYS SOON – CHARTS  The best moves are when the S&P 500 Index is also coming up out of the Green Zone.  

_________________________________________________________________________________________________________________

BUYS TODAY   7/22/2022    

UUP      US DOLLAR FUND      Money Wave Buy today, but UUP will not be Bought or Logged as the Volume was not High. 

We will “Not Log” trades if the Reward/Risk is not at least 2:1, or Low Volume. These have more risk.   

BUYS TOMORROW – SWING TRADING STOCKS 

Shop for a better price earlier in the day with Triple Buy Signal, on the same day that a Daily Money Wave Buy Signal will occur.  

MRK      MERCK & CO.      Wait for Money Wave to Close > 20 with High Volume. 

PSQ      INVERSE NASDAQ 100 FUND    Wait for Money Wave to Close > 20 with High Volume. 

BUYS SOON      

LI      LI AUTO INC.      Wait for Money Wave to Close > 20 with High Volume. 

SH      INVERSE S&P 500 FUND      Wait for Money Wave to Close > 20 with High Volume. 

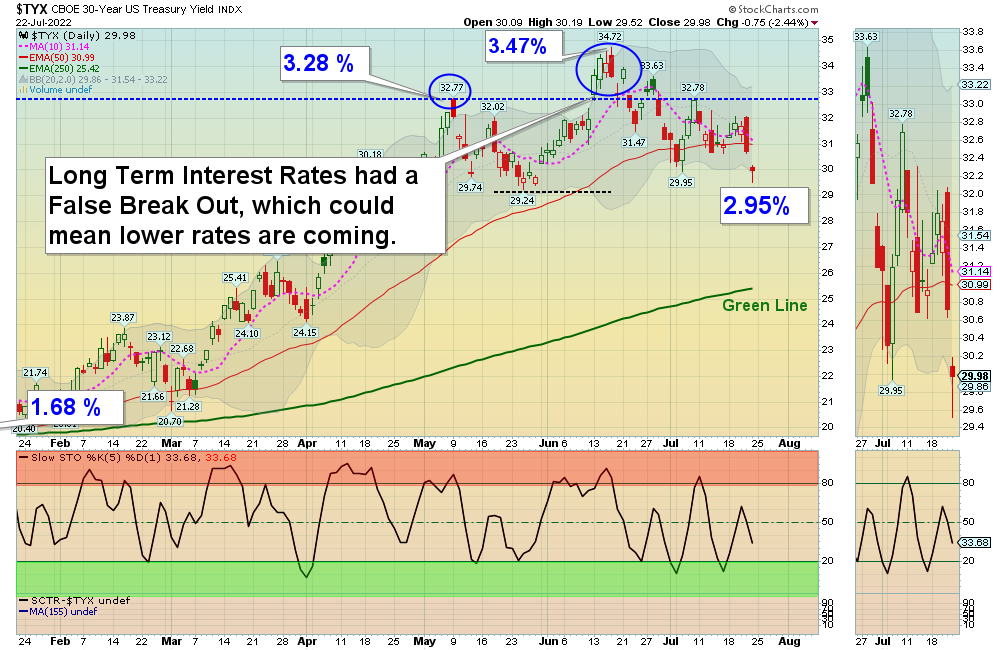
TBT      INVERSE T-BOND 2X FUND      Buy above $26.60 with High Volume with a 3% Trailing Sell Stop Loss below it.

VERU      VERU INC.      Wait for Money Wave to Close > 20 with High Volume.

Please be patient and Wait for Money Wave Buy Signals.  We will email you when they are ready. Follow on the WATCH LIST.      

The Leaders are Way Above the Green Lines (all Investments eventually return to their Green Lines).  

_____________________________________________________________________________________________________________________

SELLS TODAY                     

SIGA      SIGA TECH      EXIT if it is going to Close below the Pink Line around $13.72. The Target was already Hit for a 12.2 % Gain.

VERU      VERU INC.      EXIT if it is going to Close below the Pink Line around $15.87. The Target was already Hit for a 7.5 % Gain.

______________________________________________________________________________________________________________________

DAY TRADING SETUPS.  A few Triple Buy Pops today: SQQQ (+7%) TZA (+7%) & SOXS (+9%). Try out the New Side by Side layout. 

DAY TRADING FOR INDICES & LARGE CAPS CHARTS.

Bonds were up today, but are Way Below the Green Line.  

Crude Oil was down $1.42 at $94.93.

MY TRADING DASHBOARD 
SWING TRADING CURRENT POSITIONS
DAY TRADING SETUPS
TRADE ALERTS
GREEN LINE CHARTS AT STOCKCHARTS
ARE YOUR INVESTMENTS ABOVE THE GREEN LINE?
GREEN LINE RULES
ETF SECTOR ROTATION SYSTEM   
New TOP 100 LIST Updated Jul 1, 2022

Many like to Buy the Swing Trades just before the Close, if the Money Wave is going to create a Buy Signal (Closing > 20 and up out of the Green Zone).Don’t Buy if the Investment has already popped up too much. Money Wave Buy Signals are usually good for a 3-6 %  move in a few days.

We will “Not Log” trades if the Reward/Risk is not at least 2:1, or Low Volume. These have more risk.   

HAVE A NICE WEEKEND!

Related Post

– UUP

Subscribe to Our Newsletter

AGL Logo

Get our eBook Now!

Candlestick - A Swing Traders Friend

We don’t spam! Read our privacy policy for more info.

You’ve been successfully subscribed to our newsletter!

Voted #1 at Stock Charts

SH Chart
Inverse S&P 500 Fund (SH) will have a Money Wave Buy today.

Help Us Help Animals

Help Us Help Animals

Recent Comments

  • Market Breadth Indicators: A Trader’s Guide to Early Trend Detection on Backtesting: Definition and How a Trading Strategy Backtest Works
  • Island Reversal Pattern: Definition and Formation Explained on Double Top Pattern: How to Identify and Trade This Reversal Signal
  • Channel Pattern Guide: What It Is and Why It Matters on A Guide to Forecasting Using Moving Averages
  • What Is a Broadening Bottom Chart Pattern? Full Guide on Bull vs. Bear Market: An Investor’s Guide to Market Phases
  • ATGL Weekly Money Flow - 2025-05-11 on ATGL Top Pick of the Week! Apr 6, 2025

Become a Green Liner!

Help me make more Money in the Stock Market.

ON ATGL

  • DashBoard
  • Weekly Commentary
  • Daily Buy / Sell Signals
  • Day Trade Setup
  • Trading Rooms

Design & Develop By Pixelvect

STRATEGIES

  • Swing Trading
  • ATGL Pick of the Week
  • Dividend Growth
  • ETF Sector Rotation
  • Dogs of the Dow

HELP

  • ATGL Trading Rules
  • FAQ
  • Account Maintenance
  • Contact US
  • Join

FOLLOW US

Instagram Linkedin Twitter Facebook

© COPYRIGHT 2024 · ABOVETHEGREENLINE.COM · ALL RIGHTS RESERVED · PRIVACY · TERMS · CONTACT · WATCHLIST · CURRENT