
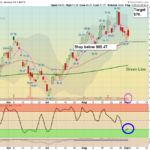
Buy Earlier in the Day with a Triple Buy Signal. Triple Buy on 60-min Chart. MARKETS ARE CLOSED TODAY FOR LABOR DAY HOLIDAY. What is TRIPLE BUY? When you receive the Daily Money Wave Buy Signal (Money Wave Indicator is going to … [Read more...]
What is a Triple Buy Signal?
Money Wave Alert! Sep 2, 2022
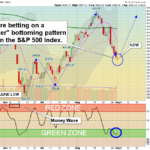
MARKETS WILL BE CLOSED ON MONDAY FOR LABOR DAY HOLIDAY. Markets closed lower again today after "gapping up" in the morning. More "weak hand" investors are being Flushed out on FEAR. We like to Buy on FEAR, and the WATCH LIST below has grown. … [Read more...]
Money Wave Alert! Sep 1, 2022
Markets were lower earlier today and Flushed out more "weak hands" on FEAR. We like to Buy on FEAR, and the WATCH LIST below has grown. Stocks probably won't rally much until the US Dollar finally peaks out. The FED should cause a slowdown and long … [Read more...]
Money Wave Alert! Aug 31, 2022
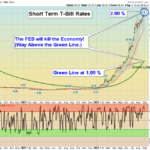
Markets were mixed today on very slow trading. The weak Tech Stocks probably won't rally until the US Dollar peaks out. The FED has T-Bill Rates almost 3 times the Green Line (FED creates Climax). This will normally cause a slowdown and long term … [Read more...]
Money Wave Alert! Aug 30, 2022
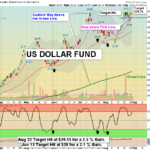
Markets were lower again today on continued mild Selling. The Tech Stocks were weak and probably won't rally until the US Dollar Fund (see above) peaks. The Dollar has gone up on expectations of the FED tightening and raising short term Interest … [Read more...]
- « Previous Page
- 1
- …
- 182
- 183
- 184
- 185
- 186
- …
- 490
- Next Page »