
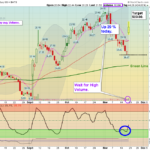
MARKETS WILL CLOSE ON FRIDAY AT 1:00 PM. Markets were mixed today on a very slow half day of trading. The Indices are re-testing last week's high, and need to Close higher to remain in an uptrend. The Indices also need to Close Above the Green … [Read more...]
Money Wave Alert! Nov 25, 2022
Money Wave Alert! Nov 23, 2022
MARKETS WILL BE CLOSED TOMORROW NOV. 24TH FOR THANKSGIVING HOLIDAY. Markets were higher again today as the Indices are re-testing last week's high, and need to Close higher to remain in an uptrend. The Indices also need to Close Above the Green … [Read more...]
Money Wave Alert! Nov 22, 2022
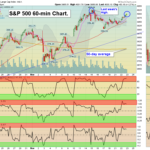
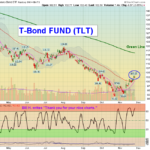
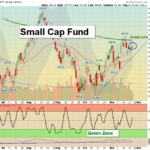
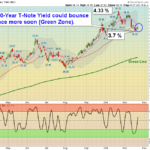
Markets were higher as the Indices need to Close higher than last week's high, and try to Close Above the Green Lines, like the DOW 30 Index has done. Volume was low, as the Markets are more over-bought for the short term. The US Dollar and long … [Read more...]
Money Wave Alert! Nov 21, 2022
Markets were slightly lower today on lower Holiday week Volume. The Indices are trying to hold above the Pink Lines (10-day avgs.) but the bounce up so far has been weak. Now the Indices need to Close higher than last week's high, and try to Close … [Read more...]
Money Wave Alert! Nov 18, 2022
Markets were higher today as the Indices were able to bounce up near the Pink Lines (10-day avgs.) Now they need to Close higher than on Tuesday, and try to Close Above the Green Lines, like the DOW 30 Index has done. Bonds are back up to the … [Read more...]
- « Previous Page
- 1
- …
- 170
- 171
- 172
- 173
- 174
- …
- 490
- Next Page »