Above the Green Line -01
  • Market Insights
        • Commentary
          • Daily
          • Weekly
        • BUY / SELL SIGNALS
          • Trade Posts
          • Recent Trade Alerts
          • Recent Day Trades
        • BLOGROLL
          • Dividend Growth Blog
          • ETF Sector Blog
          • Dow Dogs
          • TPOW Blog
  • Strategies
        • SWING TRADING
          • Current Positions
          • Watchlists
          • Closed Positions
          • Candidates - TOP 100
          • Specialty Stocks
        • WEEKLY STOCK PICK
          • TPOW Charts
          • TPOW Performance
          • TPOW Strategy Guide
          • TPOW Performance Dashboard
        • DAY TRADING
          • Watch List
        • ATGL DASHBOARD
        • ETF STRATEGIES
          • ETF Sector Rotation
          • ETF Sector Portfolio
        • DIVIDEND GROWTH
          • Dividend Growth Portfolio
          • Dividend Calendar
        • DOGS OF THE DOW
          • Dogs of the Dow Portfolio
          • DOW 5 Portfolio
  • Markets
        • US MARKET
          • Commodities
          • Energy
          • Precious Metals
          • Volatility
        • GLOBAL MARKETS
          • Market Indices
          • Economic Calendar
          • FOREX Heat Map
          • FOREX Cross Rates
          • Crypto Currency Market
  • Investing
    • Discord Community
    • Dashboard
  • Resources
        • ARTICLES
          • Dividend Growth Model Articles
          • ETF Articles
          • Investment Strategies Articles
          • Market and Economic Insights
          • Stock Trade Articles
          • Stock Reviews
        • TOOLS
          • Stock Scanners
          • Charting Software
          • Brokerage Firms
        • STOCK CHARTS
          • Key Components
          • Reading Charts
          • Drawing Stock Charts
          • Identifying Trends
        • RETIREMENT PLANNING
  • About
    • Contact Us
    • How to Win
    • #1 At Stockcharts
    • Disclaimer
    • FAQ
  • Log In
  • Subscribe

November 23, 2022

Money Wave Alert! Nov 23, 2022

IWM Chart
The Small Cap Fund (IWM) is struggling to get back up to the Green Line.

MARKETS WILL BE CLOSED TOMORROW NOV. 24TH FOR THANKSGIVING HOLIDAY.

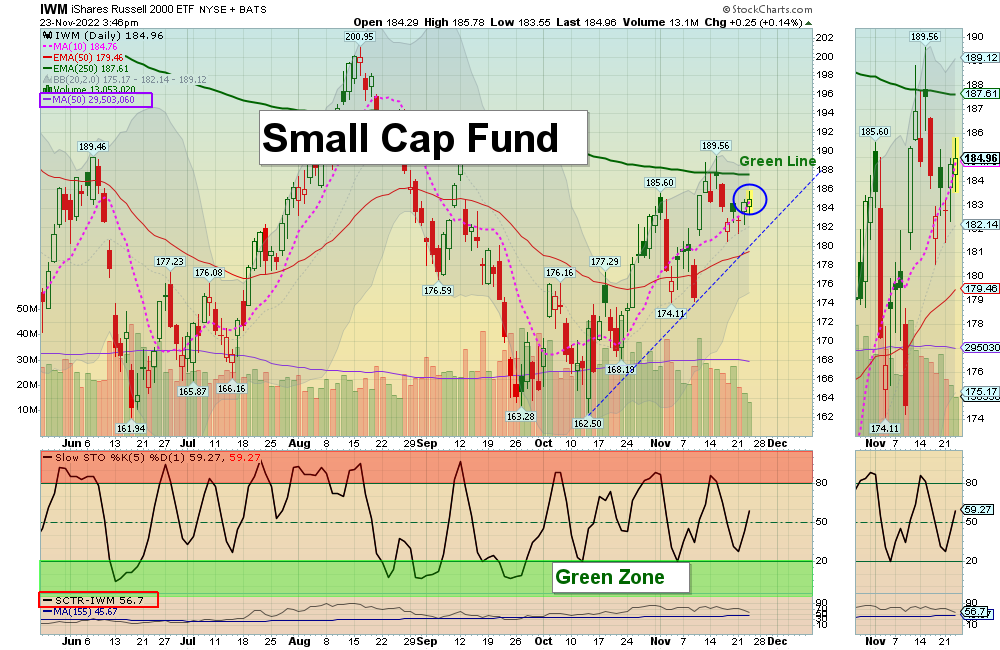
Markets were higher again today as the Indices are re-testing last week’s high, and need to Close higher to remain in an uptrend. The Indices also need to Close Above the Green Lines, like the DOW 30 Index has done. Long Term Interest Rates and the US Dollar were lower again, as they continue their Correction. Volume was low again, and the Markets are over-bought for the short term. We are waiting for more Leaders to return to the Green Zones for more Buy Signals.

The US Dollar and long term Interest Rates are still correcting back down towards the Green Lines causing Stocks to rally. The US Dollar Fund (UUP) and Inverse T-Bond Fund (TBT) are back down in the Green Zones for Buy Signals soon. Maybe RAISE some Cash on your Stocks.

Please be patient and wait for Buy Signals for that are still Above the Green Lines.  BUYS SOON – CHARTS  The best moves happen when the S&P 500 Index is also coming up out of the Green Zone. 

_________________________________________________________________________________________________________________

BUYS TODAY   11/23/2022    NONE TODAY 


BUYS TOMORROW         

GSAT      GLOBALSTAR INC.      Buy above $1.92 with High Volume with a 5% Trailing Sell Stop Loss below it.     

PSQ      INVERSE NASDAQ 100 FUND      Buy above $14.02 with High Volume with a 3% Trailing Sell Stop Loss below it.  

Shop for a better price earlier in the day with Triple Buy Signal, on the same day that a Daily Money Wave Buy Signal will occur.  

BUYS SOON               

DXCM      DEXCOM INC.      Money Wave must Close in the Green Zone.

FREY      FREYR BATTERY       Money Wave must Close in the Green Zone.     

PDD      PINDUODUO INC.     Money Wave must Close in the Green Zone. 

TBT      INVERSE T-BOND FUND     Buy above $33.11 with High Volume with a 5% Trailing Sell Stop Loss below it. 

YANG      INVERSE CHINA FUND (Leveraged 3 X High Risk)     Wait for Close Above the Green Line & High Volume.      

Please be patient and Wait for Money Wave Buy Signals.  We will email you when they are ready. Follow on the WATCH LIST.   

SELLS TODAY                

SRPT       SAREPTA THERA.      Target was Hit at $115 for a 10.6% Gain.  This trade was not logged.

UNG      US NAT’L. GAS FUND      Slipped below the Buy Price of $24.09 and was Stopped Out even. We will try to Buy again lower.

____________________________________________________________________________________________________

DAY TRADING SETUPS.  A few Triple Buy Pops today: AMC (+8%) BBBY (+7%) TARK (+7%) UNG (+7%) & SOXL (+6%). ( Try out the New Side by Side layout.      

DAY TRADING FOR INDICES & LARGE CAPS CHARTS.

Bonds were up today but are Way Below the Green Line.  

Crude Oil was down $3.64 today at $77.31.

MY TRADING DASHBOARD 
SWING TRADING CURRENT POSITIONS
DAY TRADING SETUPS
TRADE ALERTS
GREEN LINE CHARTS AT STOCKCHARTS
ARE YOUR INVESTMENTS ABOVE THE GREEN LINE?
GREEN LINE RULES
ETF SECTOR ROTATION SYSTEM   
New TOP 100 LIST Updated Nov 1, 2022

Many like to Buy the Swing Trades just before the Close, if the Money Wave is going to create a Buy Signal (Closing > 20 and up out of the Green Zone). Don’t Buy if the Security has already popped up too much. Money Wave Buy Signals are usually good for a 3-6 % move in a few days.

We will “Not Log” trades if the Reward/Risk is not at least 2:1, or Low Volume. These have more risk.   


HAVE A NICE THANKSGIVING!

Related Post

– GSAT

Subscribe to Our Newsletter

AGL Logo

Get our eBook Now!

Candlestick - A Swing Traders Friend

We don’t spam! Read our privacy policy for more info.

You’ve been successfully subscribed to our newsletter!

Voted #1 at Stock Charts

SH Chart
Inverse S&P 500 Fund (SH) will have a Money Wave Buy today.

Help Us Help Animals

Help Us Help Animals

Recent Comments

  • Market Breadth Indicators: A Trader’s Guide to Early Trend Detection on Backtesting: Definition and How a Trading Strategy Backtest Works
  • Island Reversal Pattern: Definition and Formation Explained on Double Top Pattern: How to Identify and Trade This Reversal Signal
  • Channel Pattern Guide: What It Is and Why It Matters on A Guide to Forecasting Using Moving Averages
  • What Is a Broadening Bottom Chart Pattern? Full Guide on Bull vs. Bear Market: An Investor’s Guide to Market Phases
  • ATGL Weekly Money Flow - 2025-05-11 on ATGL Top Pick of the Week! Apr 6, 2025

Become a Green Liner!

Help me make more Money in the Stock Market.

ON ATGL

  • DashBoard
  • Weekly Commentary
  • Daily Buy / Sell Signals
  • Day Trade Setup
  • Trading Rooms

Design & Develop By Pixelvect

STRATEGIES

  • Swing Trading
  • ATGL Pick of the Week
  • Dividend Growth
  • ETF Sector Rotation
  • Dogs of the Dow

HELP

  • ATGL Trading Rules
  • FAQ
  • Account Maintenance
  • Contact US
  • Join

FOLLOW US

Instagram Linkedin Twitter Facebook

© COPYRIGHT 2024 · ABOVETHEGREENLINE.COM · ALL RIGHTS RESERVED · PRIVACY · TERMS · CONTACT · WATCHLIST · CURRENT