Above the Green Line -01
  • Market Insights
        • Commentary
          • Daily
          • Weekly
        • BUY / SELL SIGNALS
          • Trade Posts
          • Recent Trade Alerts
          • Recent Day Trades
        • BLOGROLL
          • Dividend Growth Blog
          • ETF Sector Blog
          • Dow Dogs
          • TPOW Blog
  • Strategies
        • SWING TRADING
          • Current Positions
          • Watchlists
          • Closed Positions
          • Candidates - TOP 100
          • Specialty Stocks
        • WEEKLY STOCK PICK
          • TPOW Charts
          • TPOW Performance
          • TPOW Strategy Guide
          • TPOW Performance Dashboard
          • Why Weekly Trading Works
        • DAY TRADING
          • Watch List
        • ATGL DASHBOARD
        • ETF STRATEGIES
          • ETF Sector Rotation
          • ETF Sector Portfolio
        • DIVIDEND GROWTH
          • Dividend Growth Portfolio
          • Dividend Calendar
        • DOGS OF THE DOW
          • Dogs of the Dow Portfolio
          • DOW 5 Portfolio
  • Markets
        • US MARKET
          • Commodities
          • Energy
          • Precious Metals
          • Volatility
        • GLOBAL MARKETS
          • Market Indices
          • Economic Calendar
          • FOREX Heat Map
          • FOREX Cross Rates
          • Crypto Currency Market
  • Investing
    • Discord Community
    • Dashboard
  • Resources
        • INVESTING GUIDES
          • Dividend Growth Guide
          • Investment Strategy Framework
          • ETF Investing Handbook
          • Stock Trading Handbook
        • ARTICLES
          • Dividend Growth Model Articles
          • ETF Articles
          • Investment Strategies Articles
          • Market and Economic Insights
          • Stock Trade Articles
          • Stock Reviews
        • TOOLS
          • Stock Scanners
          • Charting Software
          • Brokerage Firms
          • Stocks We Review
        • STOCK CHARTS
          • Key Components
          • Reading Charts
          • Drawing Stock Charts
          • Identifying Trends
  • About
    • Contact Us
    • How to Win
    • #1 At Stockcharts
    • Disclaimer
    • FAQ
  • Log In
  • Subscribe

Buy / Sell Signals

September 22, 2023

Money Wave Alert! Sep 22, 2023

NVDA Chart

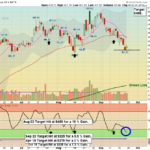
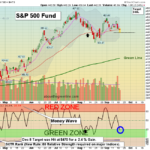
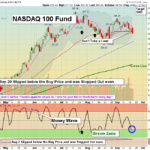
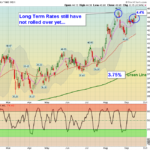
Markets were slightly higher today as the Big Techs and Semiconductors firmed up. Long term Bonds are still below  Support, so few Buyers so far. Bonds Gapped Down on panic selling, so they should bottom soon to get a good Stock Market rally.  The … [Read more...]

September 21, 2023

Money Wave Alert! Sep 21. 2023

SPY Chart

Markets were lower again today as the Big Techs and Semiconductors fell more. Long term Bonds did not hold at Support, so higher Interest Rates. Bonds Gapped Down on panic selling, so they should bottom soon to get a good Stock Market rally.  The … [Read more...]

September 20, 2023

Money Wave Alert! Sep 20, 2023

QQQ Chart

  Markets were lower again today as the Big Techs and Semiconductors fell. The FED Meeting left short term Interest Rates unchanged, but the FED talked about more Tightening in the future. Long rates need to drop to get a good Stock Market … [Read more...]

September 19, 2023

Money Wave Alert! Sep 19, 2023

SPY Chart

Markets were lower today as long term Interest Rates continued back up to the August high. Long rates need to drop to get a good Stock Market rally. Many are waiting on the FED Meeting results tomorrow. The Leaders & Indices are quickly … [Read more...]

September 18, 2023

Money Wave Alert! Sep 18, 2023

TYX Chart

  Markets were mixed today, as the Markets wait on the FED Meeting results on Wednesday. Many still are waiting on long term Interest Rates to drop which should broaden the Stock Market rally. The Leaders & Indices were back up near the … [Read more...]

  • « Previous Page
  • 1
  • …
  • 136
  • 137
  • 138
  • 139
  • 140
  • …
  • 497
  • Next Page »
FREE TRADE PICK

Get This Week's
Top Pick — Free

One rules-based swing trade signal. No credit card. No obligation.

  • Buy price, target & exit rules included
  • Based on relative strength & trend signals
  • Recent picks: +17.1%, +10.7%, +6.2%

This week's Top Pick drops Sunday afternoon

Enter your email to get it delivered to your inbox

SEND MY FREE PICK

We don't spam! Read our privacy policy for more info.

Subscribe to Our Newsletter

AGL Logo

Get our eBook Now!

Candlestick - A Swing Traders Friend

We don’t spam! Read our privacy policy for more info.

You’ve been successfully subscribed to our newsletter!

Voted #1 at Stock Charts

SH Chart
Inverse S&P 500 Fund (SH) will have a Money Wave Buy today.

Help Us Help Animals

Help Us Help Animals

Recent Comments

  • ATGL Weekly Money Flow - 2026-03-08 on ATGL Top Pick of the Week! Feb 22, 2026
  • XBI ETF Explained: Is This Biotech Fund a Smart Buy in 2026? on What Is an Expense Ratio and What Would Be a Good One?
  • XBI ETF Explained: Is This Biotech Fund a Smart Buy in 2026? on What Are Sector ETFs and How Do You Invest in Them?
  • XBI ETF Explained: Is This Biotech Fund a Smart Buy in 2026? on ETF vs Index Fund Comparison Guide for Smarter Investing
  • How to Use Net Present Value (NPV) for Dividend Stocks on How To Analyze Stocks With the Dividend Discount Model

Become a Green Liner!

Help me make more Money in the Stock Market.

ON ATGL

  • DashBoard
  • Weekly Commentary
  • Daily Buy / Sell Signals
  • Day Trade Setup
  • Trading Rooms

Design & Develop By Pixelvect

STRATEGIES

  • Swing Trading
  • ATGL Pick of the Week
  • Dividend Growth
  • ETF Sector Rotation
  • Dogs of the Dow

HELP

  • ATGL Trading Rules
  • FAQ
  • Account Maintenance
  • Contact US
  • Join

FOLLOW US

Instagram Linkedin Twitter Facebook

© COPYRIGHT 2024 · ABOVETHEGREENLINE.COM · ALL RIGHTS RESERVED · PRIVACY · TERMS · CONTACT · WATCHLIST · CURRENT