Above the Green Line -01
  • Market Insights
        • Commentary
          • Daily
          • Weekly
        • BUY / SELL SIGNALS
          • Trade Posts
          • Recent Trade Alerts
          • Recent Day Trades
        • BLOGROLL
          • Dividend Growth Blog
          • ETF Sector Blog
          • Dow Dogs
          • TPOW Blog
  • Strategies
        • SWING TRADING
          • Current Positions
          • Watchlists
          • Closed Positions
          • Candidates - TOP 100
          • Specialty Stocks
        • WEEKLY STOCK PICK
          • TPOW Charts
          • TPOW Performance
          • TPOW Strategy Guide
          • TPOW Performance Dashboard
          • Why Weekly Trading Works
        • DAY TRADING
          • Watch List
        • ATGL DASHBOARD
        • ETF STRATEGIES
          • ETF Sector Rotation
          • ETF Sector Portfolio
        • DIVIDEND GROWTH
          • Dividend Growth Portfolio
          • Dividend Calendar
        • DOGS OF THE DOW
          • Dogs of the Dow Portfolio
          • DOW 5 Portfolio
  • Markets
        • US MARKET
          • Commodities
          • Energy
          • Precious Metals
          • Volatility
        • GLOBAL MARKETS
          • Market Indices
          • Economic Calendar
          • FOREX Heat Map
          • FOREX Cross Rates
          • Crypto Currency Market
  • Investing
    • Discord Community
    • Dashboard
  • Resources
        • INVESTING GUIDES
          • Dividend Growth Guide
          • Investment Strategy Framework
          • ETF Investing Handbook
          • Stock Trading Handbook
        • ARTICLES
          • Dividend Growth Model Articles
          • ETF Articles
          • Investment Strategies Articles
          • Market and Economic Insights
          • Stock Trade Articles
          • Stock Reviews
        • TOOLS
          • Stock Scanners
          • Charting Software
          • Brokerage Firms
          • Stocks We Review
        • STOCK CHARTS
          • Key Components
          • Reading Charts
          • Drawing Stock Charts
          • Identifying Trends
  • About
    • Contact Us
    • How to Win
    • #1 At Stockcharts
    • Disclaimer
    • FAQ
  • Log In
  • Subscribe

Buy / Sell Signals

December 18, 2023

Money Wave Alert! Dec 18, 2023

METC Chart

Markets were slightly higher today on low Buying Volume.  Markets are now Way Above the Green Line which tells us that Markets no longer offer a good Reward / Risk ratio. Remember, we like to Buy on Bad News (October) and take profits on Good News … [Read more...]

December 15, 2023

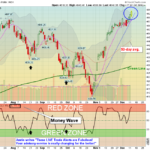
Money Wave Alert! Dec 15, 2023

SPX chart

Markets were mixed to lower today on mild profit taking.  Markets are now Way Above the Green Line which tells us that Markets no longer offer a good Reward / Risk ratio. Remember, we like to Buy on Bad News (October) and take profits on Good News … [Read more...]

December 14, 2023

Money Wave Alert! Dec 14, 2023

TLT Chart

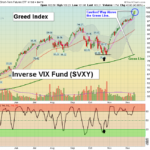
Markets were mixed today after yesterday's big Good News rally. The Herd is betting that FED easing on short term Interest Rates next year will cause a big Market rally. But Way Above the Green Line tells us that Markets have already rallied and … [Read more...]

December 13, 2023

Money Wave Alert! Dec 13, 2023

SVXY Chart

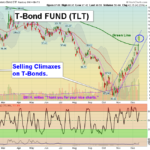
Markets were higher again today as many were worried that the FED might tighten more. But the Fed left short term Interest Rates unchanged and then talked about cutting rates next year, so panic Buying came in on the Good News. Remember, we like … [Read more...]

December 12, 2023

Money Wave Alert! Dec 12, 2023

SPY chart

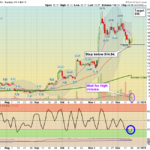
Markets were higher again today as the Techs & Semiconductors were strong. The NASDAQ 100 Fund (QQQ) made a slightly higher high for the rally to continue, but the Volume was low. The Relative Strength has really dropped on Big 7 Stocks.   The … [Read more...]

  • « Previous Page
  • 1
  • …
  • 124
  • 125
  • 126
  • 127
  • 128
  • …
  • 497
  • Next Page »
FREE TRADE PICK

Get This Week's
Top Pick — Free

One rules-based swing trade signal. No credit card. No obligation.

  • Buy price, target & exit rules included
  • Based on relative strength & trend signals
  • Recent picks: +17.1%, +10.7%, +6.2%

This week's Top Pick drops Sunday afternoon

Enter your email to get it delivered to your inbox

SEND MY FREE PICK

We don't spam! Read our privacy policy for more info.

Subscribe to Our Newsletter

AGL Logo

Get our eBook Now!

Candlestick - A Swing Traders Friend

We don’t spam! Read our privacy policy for more info.

You’ve been successfully subscribed to our newsletter!

Voted #1 at Stock Charts

SH Chart
Inverse S&P 500 Fund (SH) will have a Money Wave Buy today.

Help Us Help Animals

Help Us Help Animals

Recent Comments

  • ATGL Weekly Money Flow - 2026-03-08 on ATGL Top Pick of the Week! Feb 22, 2026
  • XBI ETF Explained: Is This Biotech Fund a Smart Buy in 2026? on What Is an Expense Ratio and What Would Be a Good One?
  • XBI ETF Explained: Is This Biotech Fund a Smart Buy in 2026? on What Are Sector ETFs and How Do You Invest in Them?
  • XBI ETF Explained: Is This Biotech Fund a Smart Buy in 2026? on ETF vs Index Fund Comparison Guide for Smarter Investing
  • How to Use Net Present Value (NPV) for Dividend Stocks on How To Analyze Stocks With the Dividend Discount Model

Become a Green Liner!

Help me make more Money in the Stock Market.

ON ATGL

  • DashBoard
  • Weekly Commentary
  • Daily Buy / Sell Signals
  • Day Trade Setup
  • Trading Rooms

Design & Develop By Pixelvect

STRATEGIES

  • Swing Trading
  • ATGL Pick of the Week
  • Dividend Growth
  • ETF Sector Rotation
  • Dogs of the Dow

HELP

  • ATGL Trading Rules
  • FAQ
  • Account Maintenance
  • Contact US
  • Join

FOLLOW US

Instagram Linkedin Twitter Facebook

© COPYRIGHT 2024 · ABOVETHEGREENLINE.COM · ALL RIGHTS RESERVED · PRIVACY · TERMS · CONTACT · WATCHLIST · CURRENT